For several years now, SEOs and digital marketers have made direct comparisons between Google and Bing.
Most of these findings are well documented; for example, aside from the key differences in functionality and search algorithms, we know that Bing prioritizes social and local search, while Google arguably has a more stringent quality criteria for ranking content (EAT – or expertise, authoritativeness, and trustworthiness).
To bring you some unique – and hopefully more interesting – insights, we decided to approach our Bing vs. Google comparison from a more quantifiable, data-based perspective. To do this, we used the Semrush .Trends toolkit.
Let’s take a look at what we discovered.
The first .Trends tool we used to conduct our analysis is Market Explorer, a competitive intelligence tool. To provide a comprehensive market overview, this tool shows a list of top market players and their market share, as well as insights into market dynamics, audience characteristics, and key industry trends.
Tool Tidbit: To provide the best results, the Market Explorer tool requires a minimum of 3 domains for competitor analysis. Therefore, we have also included results for Yahoo in this study, although the primary emphasis of our evaluation is on comparing Google and Bing. In addition, Market Explorer data is only viewable by country, so the data below is focused only on the US.
In terms of awareness and influence, Google is undoubtedly the main player in the search engine market. The practice of “Googling” something has become ingrained in the cultural vernacular, while countless memes dismissing the relevance of Bing have done the rounds for over a decade. “Google” as a verb even made the Oxford English Dictionary in 2006.
Therefore, it’s a good starting point to try and look beyond these cultural factors, and see what the traffic data says. Specifically, we can directly compare their market share, and get a sense of just how big the perceived traffic divide is.
The Share of Visits report is useful here, as it looks at how much traffic each domain gets as a percentage of the overall market traffic. In the data below for July 2021 (US only), we see that Google has a much larger Share of Voice compared to Bing (87.94% vs 1.96%).
If we remove Yahoo from this list, then that figure is actually closer to 98%, with Bing still loitering below the 2% mark.
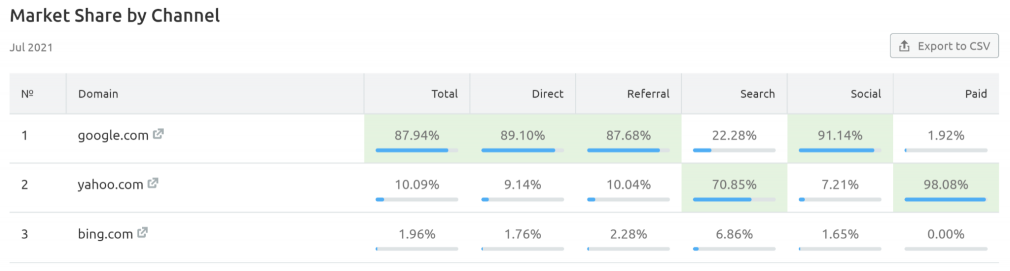
Given that over two-thirds of online experiences start on a search engine, it’s also worth paying particular attention to the Direct Traffic metric in these tables.
We can see that Google generated 11.1B direct visits during this month, while Bing got 219.5M; this also works out to around a 98% share of direct traffic for Google and approximately 2% for Bing.
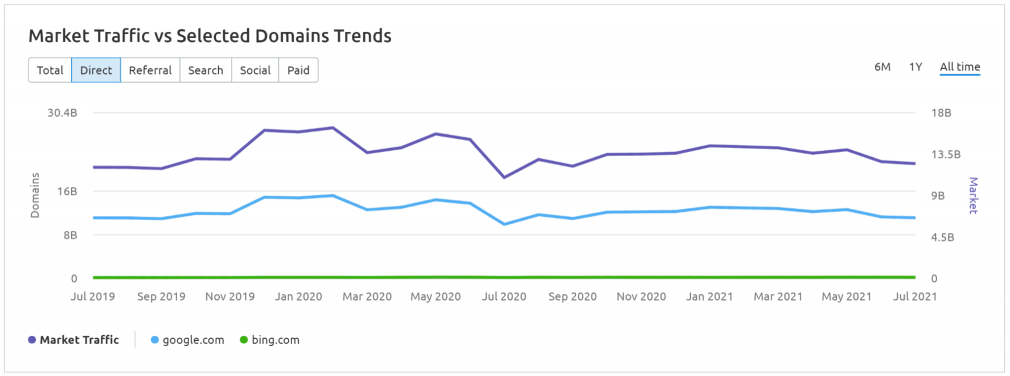
This market traffic trend data has been pretty consistent over the past two years, with Google’s domain trend generally indicative of the wider market trend. This confirms just how influential Google is within this market, and how dominant it is in comparison with Bing.
Traffic Growth
It’s not all doom and gloom for Bing, though. As we can see in the Growth Quadrant report – a market research feature that helps you visualize the competitive landscape – Bing’s US traffic volume grew by nearly 30% year-over-year (YoY), while Google’s growth was around 12%.
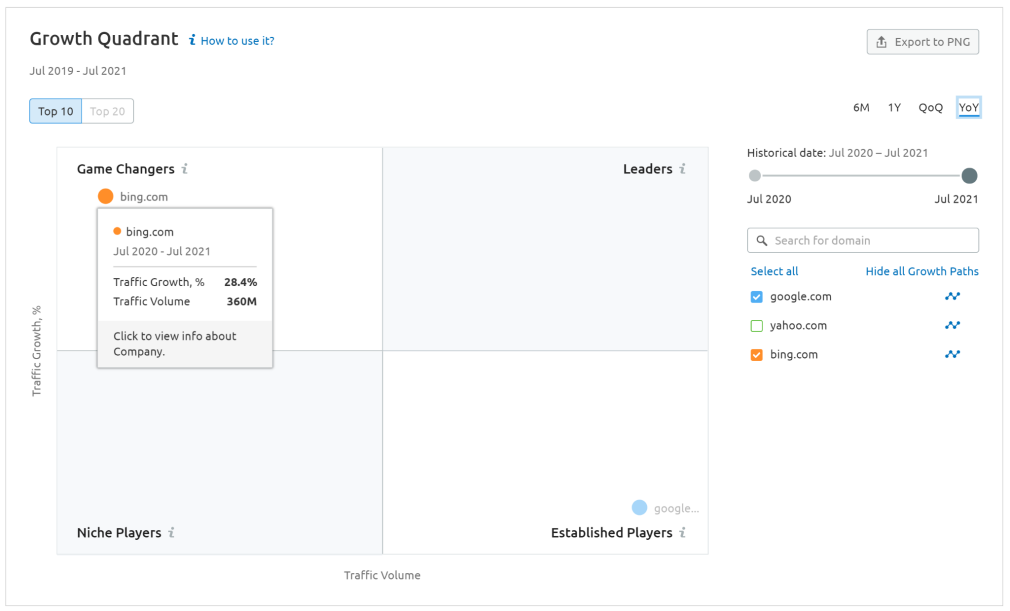
Traffic Growth % reflects the pace at which researched competitors expand within the market. Traffic Volume represents the current audience size.
It should be noted that, as a direct comparison, this isn’t particularly groundbreaking data; Google is a firmly established player and, as a result, isn’t likely to see huge YoY growth. However, it does suggest that Bing is growing rapidly in popularity, which is something to keep in mind when planning out a content and/or digital marketing strategy.
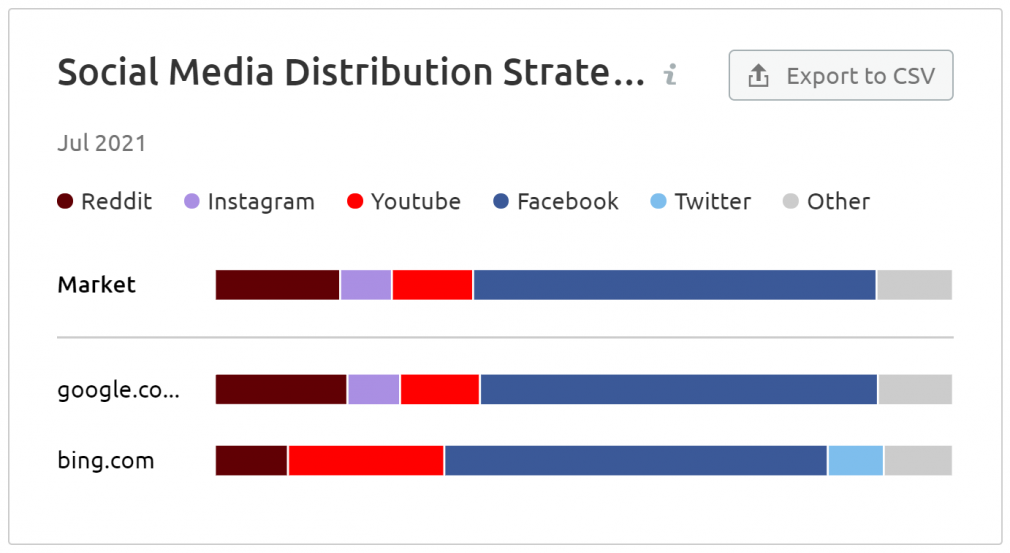
This is especially true if YouTube is one of your primary marketing channels, as Bing places a much larger emphasis on video search and integration than Google (even though Google owns YouTube). This is evident in the Social Media Distribution widget, which identifies the ratio of each domain’s social media focus (and benchmarks them against the market average).
Looking at July 2021, we see that YouTube made up 22% of Bing’s social media focus – almost double that of both Google and the market average.
Age Demographics
Within Market Explorer, another benchmarking report that we looked at in our Google vs Bing analysis was the Audience report – specifically the Age Demographic data.
We found it interesting that, while Google is the most popular search engine for 18 to 34 year olds in the US, Bing is the preferred option for older generations including, surprisingly, the early millennial (35-44) demographic.
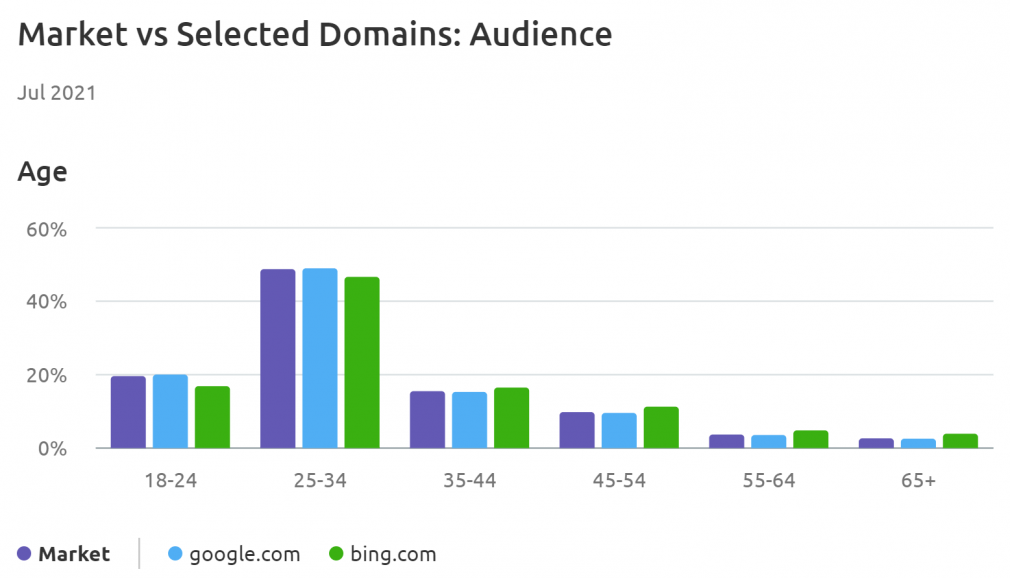
This could be a useful insight if the age range of your target audience is somewhere in the 35 to 65+ range, especially if you are currently only focusing your SEO efforts on ranking in Google.
These particular reports within the Market Explorer tool can be useful for highlighting some of the more surprising differences between Google and Bing, but let’s take our analysis even deeper by looking at the other tool in the .Trends suite: Traffic Analytics.
Learn About Your Traffic Statistics
with the Market Explorer Tool

Google vs. Bing Through the Lens of Traffic Analytics
Traffic Analytics is, as the name suggests, designed to provide more insight into the makeup of a site’s traffic and audience, as well as the journey those users take. It can be particularly useful as a competitive analysis tool for multiple domains, although, for our purposes here, we’ll use it to highlight the differences between Google and Bing.
Traffic Breakdown
When looking at the main Traffic Analytics dashboard report for July 2021, we can see that Google’s total global traffic was 48.9B.
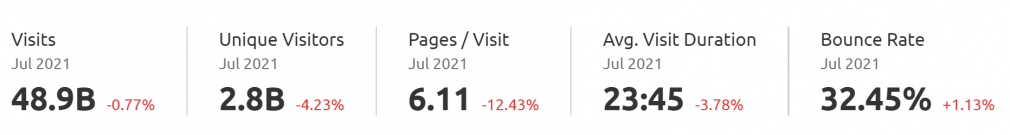
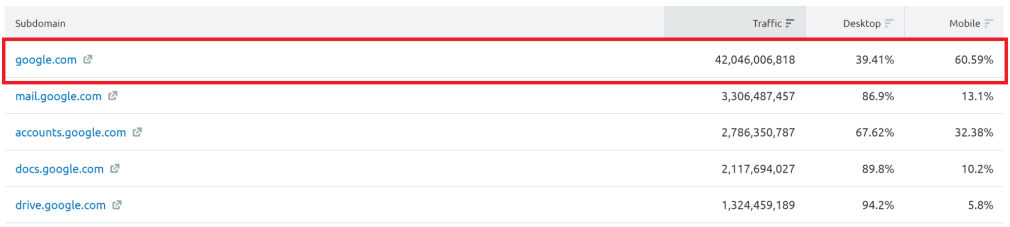
However, it’s important to note that this figure also includes the traffic for Google’s various subdomains, such as Gmail, Google Analytics, and Google Docs. Therefore, for the purposes of comparing Google as a search engine only, we focused only on the subdomain “google.com.”
This adjustment brought us to the more accurate figure of just over 42B (see below).
In the US, this figure was approximately 11.7B, or around 28% of Google’s total global monthly volume.

Following the same steps, we then looked at Bing’s global traffic volume for July 2021, which was 893M.
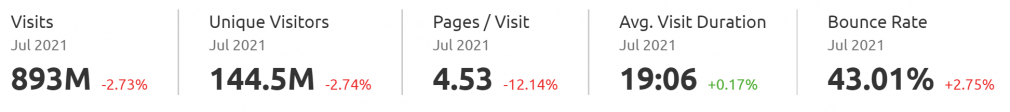
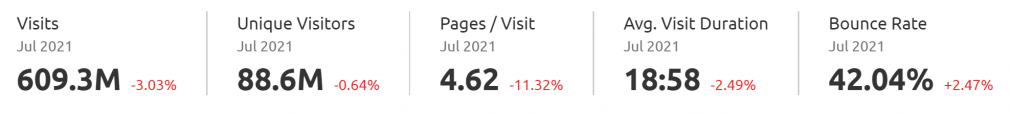
Monthly traffic in the US was just over 609M, accounting for a much higher percentage (68%) of total global volume than in Google’s case.
This suggests that US traffic makes up a far more significant portion of Bing’s traffic than Google’s, although as we can see in the next section, these geographic trends can often be dynamic.
Geographic Distribution
Armed with these insights, we thought it worthwhile to look more closely at the geographic markets where Google and Bing are most popular.
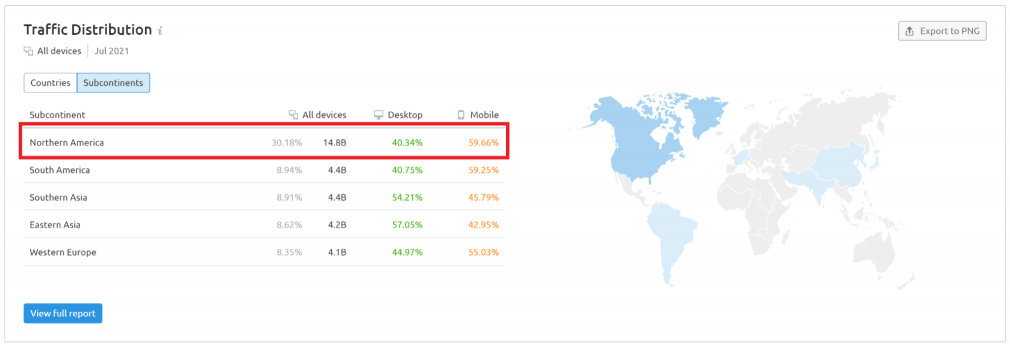
Importance of North America
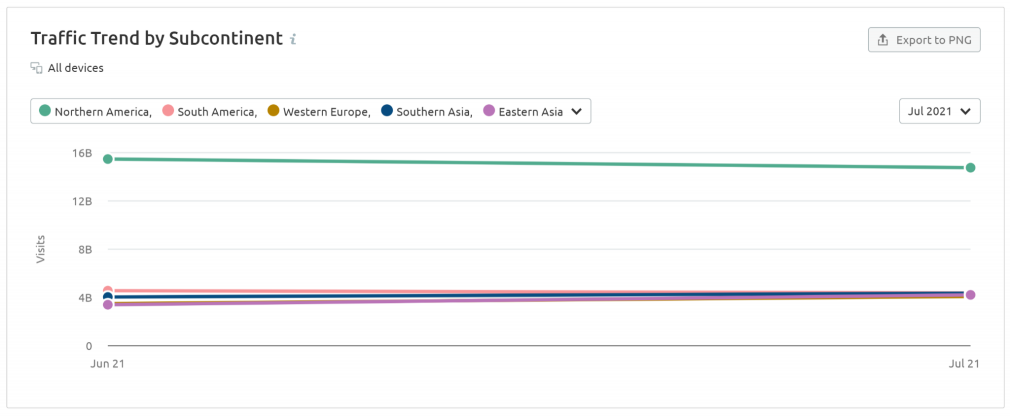
In July 2021, 30% of Google’s total combined monthly traffic (14.8B visitors) came from North America.
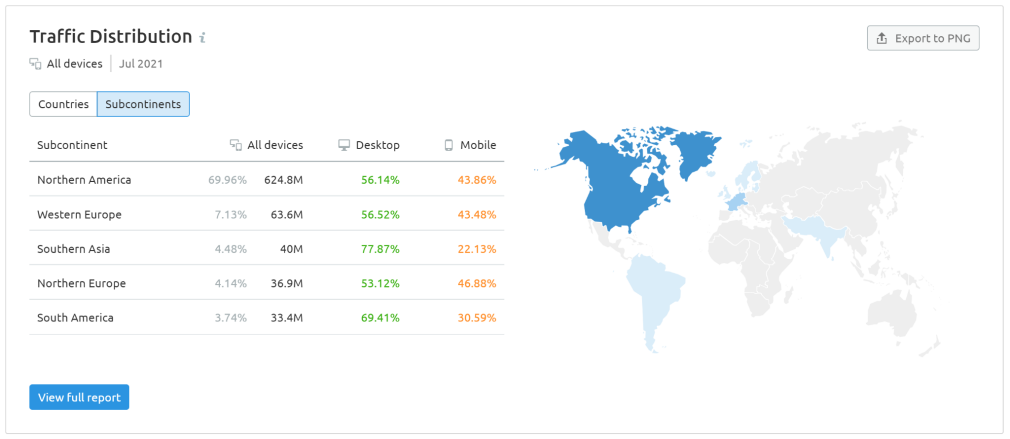
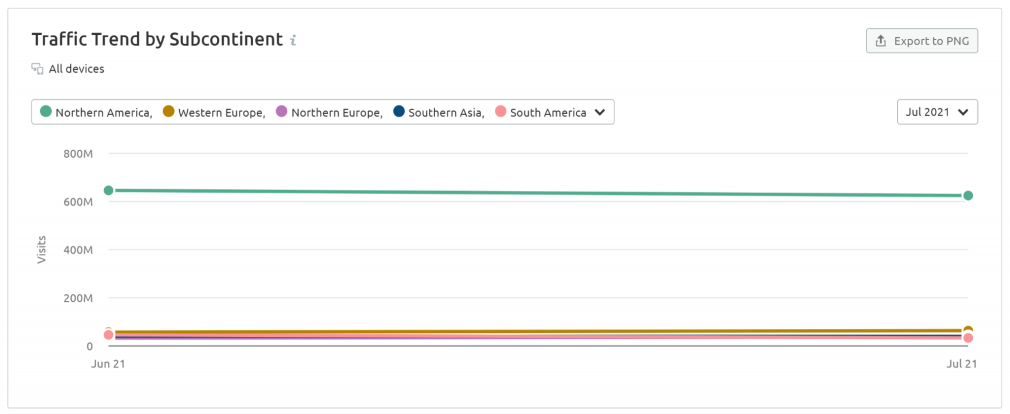
For Bing, the total monthly traffic from North America was 70%, pulling in 625M visitors. Nearly all of that figure (609M visitors) came from the US, reinforcing its importance as a traffic source for the platform.
Other Geographic Traffic Trends
Google’s traffic volume over the last year has grown in Southern and Eastern Asia, while it has decreased slightly in North America
Bing, meanwhile, has seen slight 1-year traffic increases in Western and Northern Europe, while losing traffic in South America.
Although these longer-term shifts are relatively minimal, it’s still worth keeping an eye on the traffic trends of Google and Bing within your geographical target market, especially if your target audience is primarily based in a specific location.
Traffic Trends
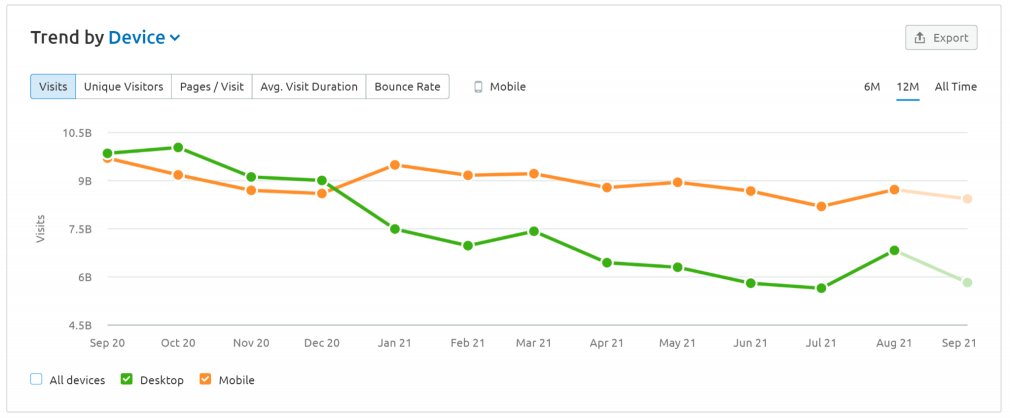
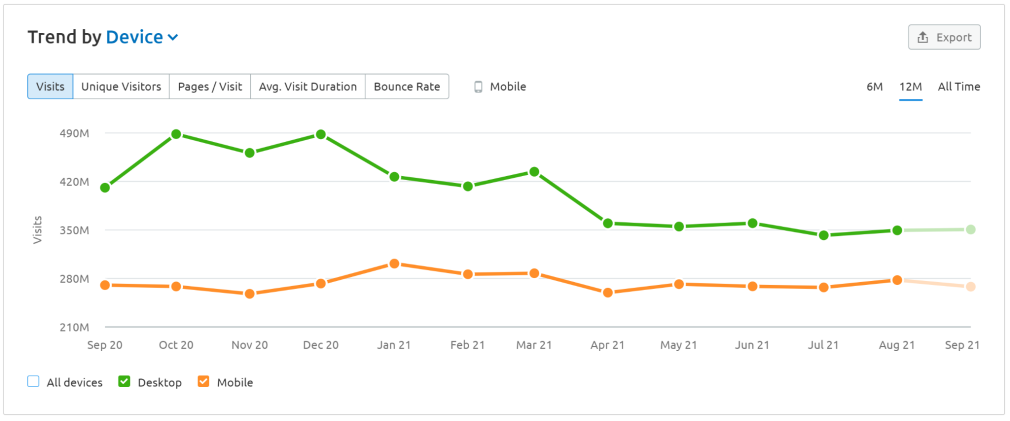
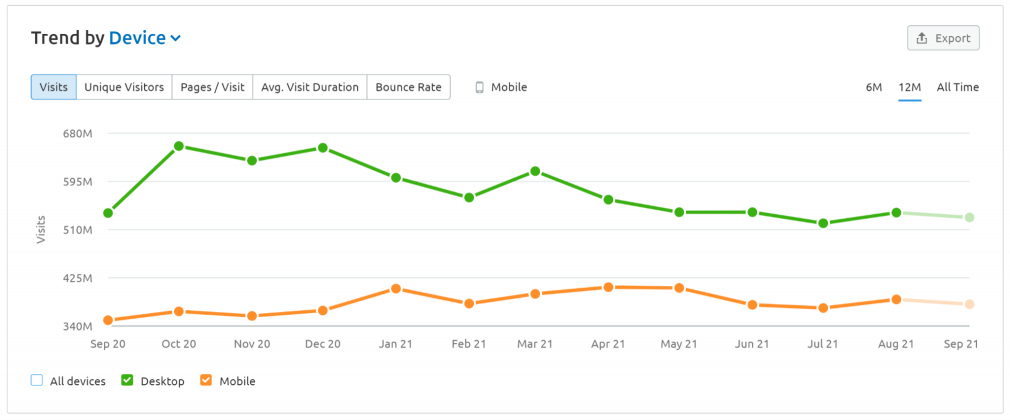
While we’re on the topic of traffic trends, one of the most interesting insights can be found by reviewing longer-term patterns. For example, within the last 12 months, Google’s mobile traffic has overtaken its desktop traffic in the US.
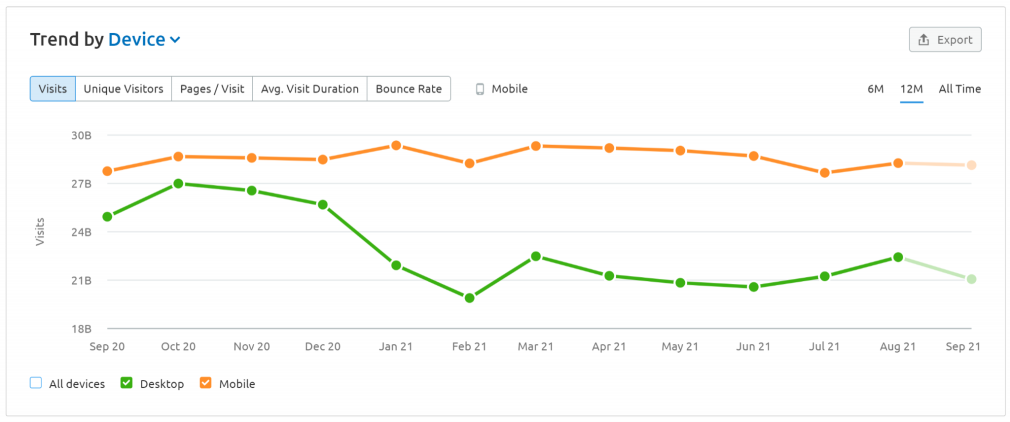
We can also see a similar, albeit less drastic, pattern when accounting for all geographic regions.
It’s possible that this is a combined result of both the Google search bar (and Google tool suite) being preloaded by default on all Android mobile devices, as well as the general increase of mobile device traffic over the last few years.
However, the majority of Bing’s traffic – both in the US and across all regions – is still on desktop.
This is possibly due to Microsoft’s dominance in the desktop OS market, with Bing preloaded as the default search engine on all desktop devices using Windows.
Either way, it’s worth taking these differences into account, and ensuring that your website is always optimized for both mobile and desktop.
Search Features
Given that both Google and Bing offer a variety of search features, it’s a good idea to compare some of these more closely, too.
In particular, let’s look at:
- Text search
- Image search
- Video Search
- News
- Maps
- Shopping
Using the Top Pages report in Traffic Analytics, we can segment each search engine’s traffic for July 2021 to dig deeper into these features.
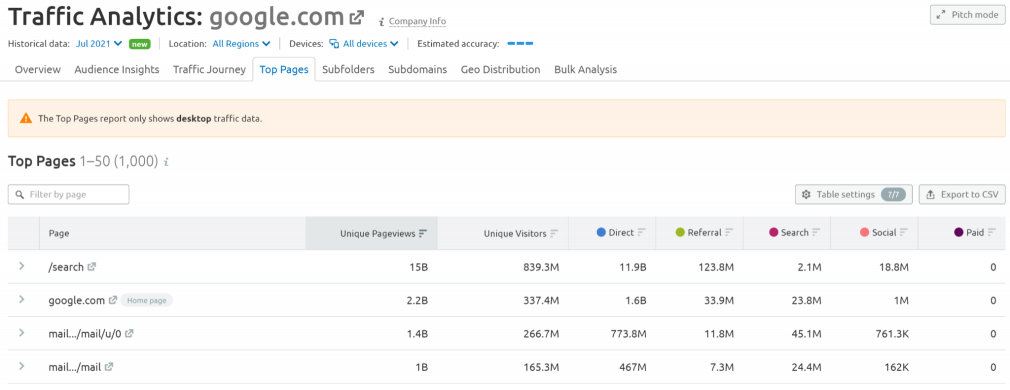
Something to note here is that, unlike Bing, Google’s text, image, and video searches are categorized under one subfolder, so it’s not possible to accurately segment that traffic using an external tool. In fact, Google does not disclose this information publicly.
However, even without that information, the data we can access can still give us interesting insight into the makeup of each search engine’s features.
Note: The Top Pages report only provides desktop traffic data.
Unique Pageviews in July 2021 (From Traffic Analytics)
|
|
Bing |
|||
|
Global |
US Only |
Global |
US Only |
|
|
Text Search |
15B (96.8%) |
3.2B (94.4%) |
433M (83.2%) |
301M (83.4%) |
|
Image Search |
50M (9.6%) |
33M (9.1%) |
||
|
Video Search |
25M (4.8%) |
18M (5%) |
||
|
News |
236M (1.5%) |
109M (3.2%) |
3.5M (0.7%) |
2.7M (0.7%) |
|
Maps |
244M (1.6%) |
71M (2%) |
5.3M (1%) |
3.4M (1%) |
|
Shopping |
19.3M (0.2%) |
9M (0.4%) |
3.6M (0.7%) |
2.8M (0.8%) |
|
Total |
15.5B |
3.4B |
520M |
361M |
While it is difficult to draw any comparisons between the text, image, and video search figures, it is interesting to see that Bing gets a larger percentage of its own traffic share for shopping than Google does, both in the US and globally.
That said, Google gets a higher share of its own traffic for Maps and News, which might be something to consider if, say, newsjacking is a prominent tactic in your content marketing strategy.
Key Takeaways
So, now that you have these insights from our Bing vs. Google analysis, what can you do with them?
First and foremost, given the data, it’s advisable to try and rank your content for both search engines. While Google obviously dominates in terms of traffic volume (both in the US and globally), Bing is growing rapidly year-over-year and should not be ignored.
The data also suggests that Bing:
- Is popular among older age demographics, including that sought-after early millennial (35-44) demographic
- Is highly YouTube-focused (which is good news if YouTube is an important marketing channel for you)
- Is growing in popularity in Europe (while Google is seeing traffic increases in Asia)
- Gets a higher percentage of Shopping traffic (against its total search traffic) than Google
Therefore, a smart strategy is to ensure that your content is always fully optimized not just for Google, but for Bing as well.
As Jason Barnard states, it’s always a good idea to cover your bases:
Bing and Google are organized and function on very similar lines. Importantly, since both are building algorithms with exactly the same goal — that is, to guide their user to the best solution to their problem as efficiently as possible — from an SEO standpoint we can (and should) approach both with one unified strategy.
Optimizing Your Content
As anyone in the world of content knows, optimizing your articles and blog posts to rank is challenging enough in one search engine, let alone two.
On a positive note, though, having the right set of tools at your disposal certainly makes it easier. For example, if we circle back to Market Explorer, this tool can help you to dig much deeper into what your competitors are doing, and uncover insights that are useful, actionable, and – as you’ve seen in this article – often surprising.
Of course, competitor analysis is just one of several steps in the content optimization process; ranking your content requires a lot of additional work (don’t worry; we’ve got plenty of other tools to help with that, too).
But as long as you’re creating content that is helpful, unique, and credible, and you are supplementing these efforts with the correct tools, you will eventually be able to reach your audience on any search engine.
