
Needless to say, Google’s core updates can make or break a site. But what if the core updates were stabilizing? What would that mean for sites and for the SEOs who work on them?
The modern “core update era” has produced some of the most notable algorithmic changes the SEO industry has ever seen. You could argue that the updates have changed the very nature of the conversation the industry has had around things like page and site quality (look no further than the renewed focus on E-A-T). With each new roll-out, the SEO industry bites its nail in nervous anticipation as, historically speaking, the updates have thrown rankings into a tizzy.
But is that still true—at least to the same extent?
Are the core updates Google releases today as potent as the juggernauts of years past, such as 2018’s Medic Update?
Having personally tracked these updates since March of 2018, my hunch has been that the changes Google has made more recently pack less heat.
To find out, I analyzed the levels of rank volatility of every core update since the infamous Medic Update.
Here’s what I found…
Core Update Analysis: What Was Analyzed & What Was Found
Despite what you may think, this right here is the most important part of the study. Without understanding what was analyzed and how it was analyzed, it’s not possible to have enough context to properly apply anything.
Personally, it’s a pet peeve of mine that SEO studies don’t properly discuss their limitations. Understanding the confines and conceptual “borders” of a study is vital to being able to effectively make use of it.
With that, let’s quickly dive into the data I analyzed as well as some of the top-level findings.
(If you want to get right into it—which I don’t recommend—you can, of course, scroll down to the next H2).
About the Data Analyzed
For starters, this study only goes as far back as the “modern” core updates do. Core updates have been around long before they became a “thing.” Broad core algorithm updates have been released by Google several times a year well before Google began confirming them in March of 2018.
Now, to that, I began my analysis not with the March 2018 Core Update but with the Medic Update of August 2018. I did this because the Medic Update is almost symbolic of the modern era of SEO. With the update, many of the industry’s thought leaders began noticing new patterns around how Google profiles site and page quality. It was really the Medic Update that brought Your Money Your Life (YMYL) and E-A-T into focus. So, despite the fact that the March 2018 update was the first to be confirmed by Google’s Danny Sullivan, I chose to begin this analysis with the Medic Update.
Here’s the full list of core updates that were analyzed in this study:
- The Medic Update
- The March 2019 Core Update
- The September 2019 Core Update
- The January 2020 Core Update
- The May 2020 Core Update
- The December 2020 Core Update
- The June 2021 Core Update
- The July 2021 Core Update
For each of these updates, we recorded the volatility levels as seen within the Semrush Sensor. The problem is, the Sensor scores the level of volatility seen each day with something that looks like this:
The score you see here is relative to the preceding period of volatility. Meaning, if you were to have had an extreme period of algorithmic calm, even a lesser change would be seen as “volatility.”
In other words, you cannot just say, “Well, the Medic Update scored a 9.9 on the Sensor, and the March 2019 Core Update scored a 9.7; so therefore the Medic Update was ‘bigger’ (for the record those are not the real Sensor numbers for either update).”
To circumvent this problem, we measured the percentage change between the period of stability preceding each update to the period of volatility represented by each update. In this case, we’re not looking at the number per se (i.e., a volatility level of 9/10) but rather how much volatility increased relative to the period of stability that preceded it. So, if during one update the levels went from 2/10 to 4/10 while during another update they went from 5/10 to 10/10, both would score a 100% increase in volatility.
To better capture the overall stability of each update, we calculated the increases by comparing the three days of relative calm before the update to the first three days that represented the update itself. This is because an update, as a rule, takes more than one day to roll out.
Now, not every update is the same. Some updates are very volatile for 3–4 days, others are volatile the first day but not so much on the second, while others can show volatility for an extended period of time. This accounting of how updates can roll out was not considered on a per update level. The same methodology was applied across the board.
Lastly, all of the industries that comprise the data seen in the Sensor were included in the overall analysis of the updates. This means that circa 25K keywords were analyzed for each update.
There were some instances where I specifically analyzed the trends within each niche industry. I did not utilize all industries but focused on a specific group of niches. I will point out when and why this was the case as I go through my analysis.
Top-Level Data Findings
With a proper accounting of the data’s context “out of the way,” here are some of the top-level data highlights:
- The overall average rank volatility increases seen during a core update stands at 59.77%.
- Only two of the core updates analyzed produced volatility increases of 100% or over (The Medic and September 2020 Core Updates).
- The average level of volatility seen during an update has decreased by 51.7% since the January 2020 Core Update.
- Volatility is still not universal. Rank volatility across some of the most prominent industries can still remain incredibly volatile despite the seemingly overall decrease in rank fluctuations.
Of course, all of this data needs to be discussed, explained, and qualified—which is exactly what I plan to do!
The Data Points to a Possible Decrease in Core Update Potency
The most logical place to start is, of course, with total volatility over time. For this, we pulled the rank volatility increases for each of the core updates that Google released, starting with the Medic Update and ending with the most recent update: the July 2021 Core Update.
As you can see, there is a clear downward trend in the rank volatility increases displayed by the core updates over time. Even excluding the only two updates to show rank volatility increases of 100% or more (i.e., the Medic Update and the September 2019 Core Update), the trend remains true. That is, starting with the December 2020 Core Update, there has been a trend where the volatility increases fall significantly below 50%.
However, there is a bit of a caveat to the trend since Google split the June 2021 Core Update into two parts (the first being reflected as the June 2021 Core Update and the second being the July 2021 Core Update). The question is what would have happened had Google released both the June and July updates together as was initially intended?
Still, there is no reason to question the 40% volatility increase seen during the December 2020 Core Update. This update still fell well under the 59.77% volatility increase average seen across all of the updates and is clearly a divergence from the preexisting volatility trend
Still, there are a couple of ways that you can parse this.
On the one hand, you could look to make a cut-off with the September 2019 Core Update as it was the last time rank volatility increased by 100% or more. Conversely, you could argue that the real shift in the data trends begins with the December 2020 Core Update.
Personally, I think the September 2019 Core Update represents a good line of demarcation as it would seem to represent the end of the “monstrously large” core updates. Though I do see the other side of the coin as well.
To that, here’s how the numbers play out if you were to parse it various ways:
No matter how you slice it, whether you group the updates from January 2020 and on or by December 2020 and on, the volatility trends seem to point to the updates becoming less and less potent.
A Trend of Less Powerful Core Algorithm Updates?
The question is: Are we seeing a new trend, or is this all coincidental?
I don’t work for Google, so it’s impossible for me to say with total certainty if the data trends are purposeful or not. However, the fact remains that we have not seen a core update with 100% increases in volatility in almost two years. That’s a significant amount of time.
As far as the decrease in volatility seen since the December 2020 Core Update, my intuition—based on studying the updates for years and in seeing this data—is that the updates have become a bit less powerful over time.
Later on in this article, I’ll explore why I think that makes a good deal of sense so as to add further support for this notion.
For now, let’s keep sifting through the data.
Rank Volatility at the Industry Level Still Remains High
Beyond the overall rank volatility trends exhibited by the core updates, one of the things I was interested in studying was how the various niche industries have behaved over time. Are certain industries more volatile than they used to be or vice versa? Are there new industry-level patterns that match the overall data trends?
To do this, I looked at the following industries:
- Books and Literature
- Real Estate
- Travel
- Science
- Home and Garden
- Food and Drink
- Shopping
- Finance
- Health
There are various reasons why I chose these niches over others. Fundamentally, it came down to two criteria. First, if the industry was YMYL (Health, Finance, and technically Shopping as well as Home and Garden—though retail keywords are not the same in terms of their YMYL status as far as the core updates are concerned). Secondly, the nature of the keywords found within the industry. For example, Books and Literature include a lot of entity-based keywords, whereas Science contains many informational keywords.
As I was digging into the industry-level data, one of the things I noticed was that a lot of the niches I chose to work with showed higher-than-average levels of volatility. That is, their volatility increases were at times significantly higher than the average across all industries. (Of course, there were times and industries that were below the average as well.)
Seeing that, I calculated the percentage increase/decrease of the various industries in relation to the baseline.
Here’s how much much greater/lesser the rank volatility for the industries was as compared to the baseline across all core updates:
As is evident above, the Heath, Real Estate, and Travel niches are incredibly more volatile than the average. Overall, all of the niches analyzed have been 57.34% more volatile than the overall average across all core updates. (For the record, I would like to dive into the Real Estate niche before I draw any conclusions about it, as I wonder if listing changes are behind a substantial amount of volatility here.)
The question is: Are the more volatile industries moving closer to the average volatility seen overall as time goes on?
Based on what we’ve already determined in regards to the Medic and September 2019 updates being of a particularly volatile nature, it’s expected that the industry level volatility would also be above average when looking at these updates.
The data above shows that while these particular industries are generally more volatile than average, they were roughly 14% more volatile than “usual” with the first three core updates analyzed. This is again totally expected considering how volatile things were back in August 2018 and September 2019.
When I analyzed the remaining updates (i.e., all core updates from January 2020 and on), it seemed as if there was a slight stabilization with the industry performing closer to the overall average across all niches.
This data would reflect an 18% increase in stabilization relative to the baseline as compared to the numbers shown by the first three core updates analyzed. Moreover, this would present an 8% increase in stabilization relative to the overall average as compared to the full set of core updates.
However, if we look at just the updates from the December 2020 Core Update and on, the numbers tell a bit of a different story:
When you effectively remove the January 2020 Core Update from the mix, the industries represented are 59.18% more volatile than the dataset overall, which is a tad higher than the average seen across all updates (i.e., 57.34%).
To make this a bit clearer, here is how much more volatile these niches were relative to the overall data according to different groupings of the updates.
You can clearly see that the overall trends towards less and less volatility did not hold true. Had it done so, the niches analyzed would not have been 59.18% more volatile than the overall average when looking at December 2020 and on—a figure that is higher than when January 2020 is included.
The Bottom Line
The niches don’t necessarily align with the overall pattern of decreased volatility. There are still niches that are both incredibly volatile and static in their levels of overall volatility. It is not the case that the niches have become more muted in their rank movement in accordance with the overall average. The decrease in rank volatility is not uniform.
If we dive into the patterns within some of the niche industries, this will become more evident.
Niche Industry Patterns Across the Core Updates
Data is only as good as the details it speaks to. Instead of simply talking about the industry-level trends, I would like to walk through a few of the industries so that we can get a better understanding of what their core update volatility looks like over time.
To do this, I am going to compare the levels of volatility seen within an industry over the course of the core updates to the overall average volatility recorded.
Health Industry Core Update Trends
There’s no better place to start our per industry analysis than with the Health industry. It’s the only industry to have a core update named after it (i.e., the Medic Update). tI’s the most “YMYL” of all the YMYL niches (as bad advice here can actually kill people), and it sits at the center of the E-A-T conversation.
Just looking at the data, it’s also a really good example of how the overall volatility trends do not apply at the industry level.
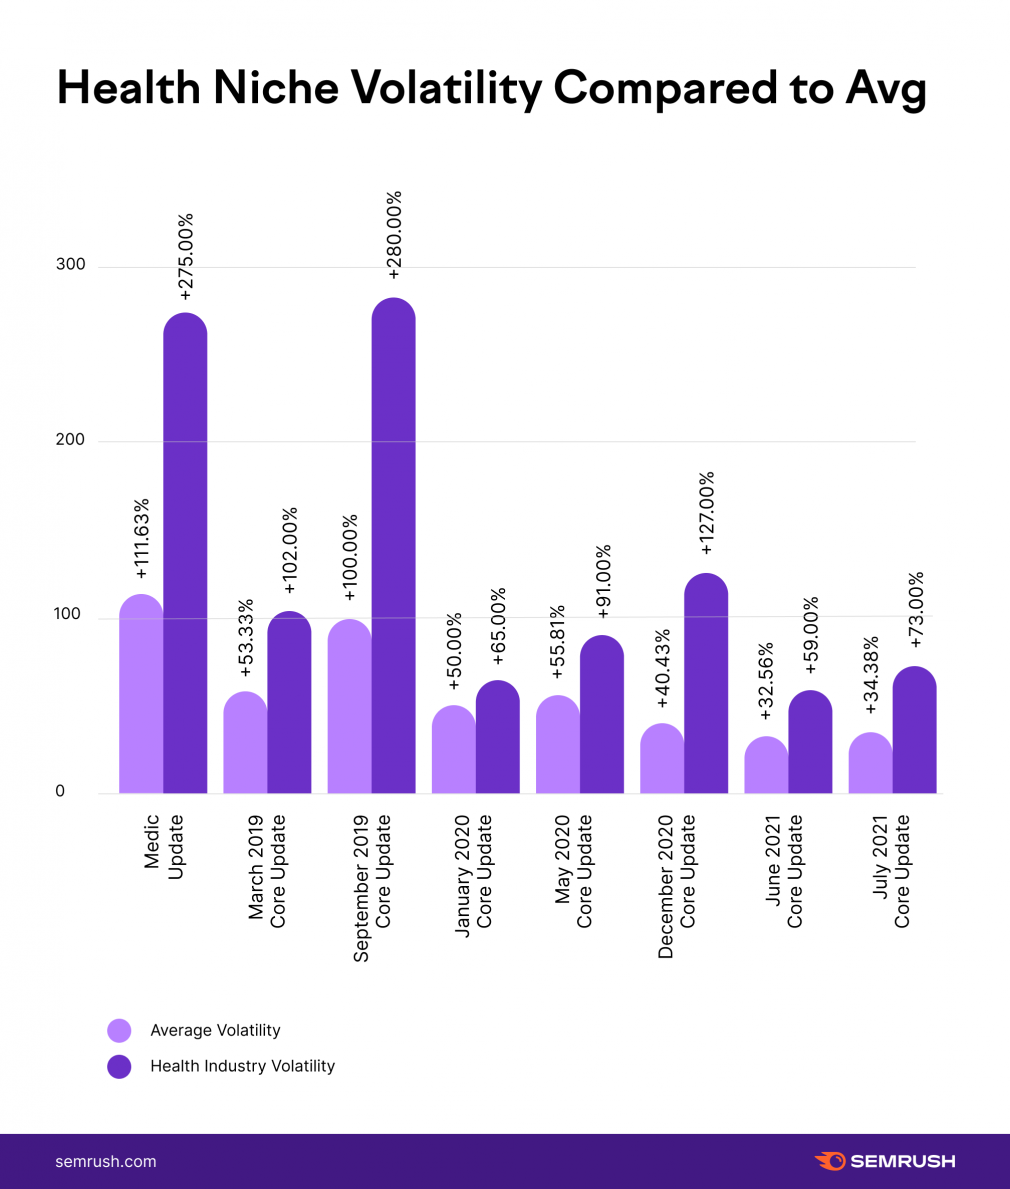
The health niche was just unbelievably volatile through the first three core updates I analyzed. For both the Medic and the September 2019 Core Updates, the Health niche displayed significantly more than double the levels of volatility recorded overall.
For our purposes and from a trends perspective, the Health industry was 214% more volatile than the average industry during the December 2020 Core Update. Moreover, it displayed over 100% increases in volatility as well. Remember, the December Core Update was the first update to record volatility levels lower than 50%. Yet, the Health industry was still incredibly shaken up by the update.
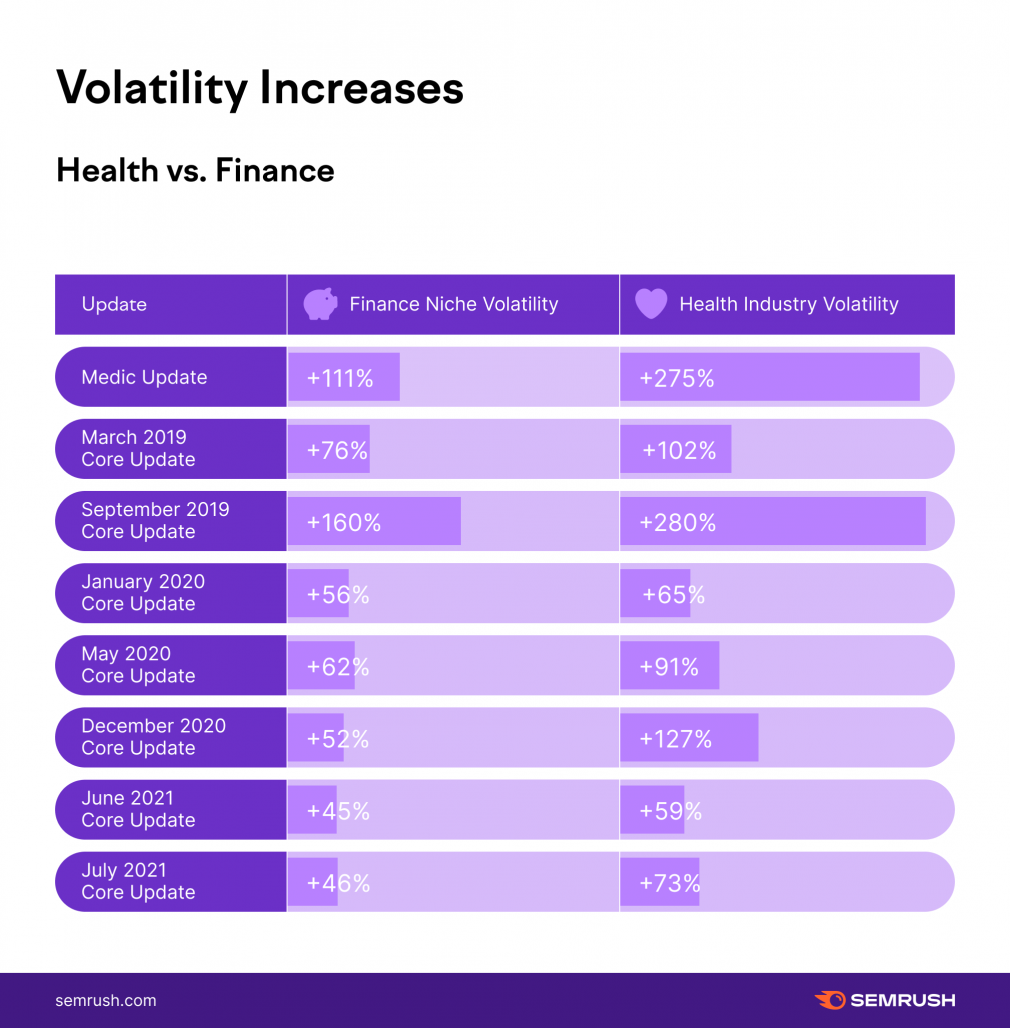
Parenthetically, the Finance industry (which I might consider to be the Health niche’s YMYL sibling) showed a very different data trend. Surprisingly, the Finance niche never produced levels of volatility that exceeded the overall average by more than 100%. The highest divergence from the overall average came with the September 2019 Core Update, where the niche was 60% more volatile than average.
That’s not to say there were not extreme levels of volatility. However, across all updates, the Finance industry has 28.46% more volatility than average, which is nothing compared to the Health niche’s 114.64%.
Travel Industry Core Update Trends
The Travel industry is another good example of volatility not being consistent nor following the overall trend towards less rank movement. In fact, the Travel industry displayed rank volatility that exceeded 100% of the overall average during 5 of the 8 updates I studied.
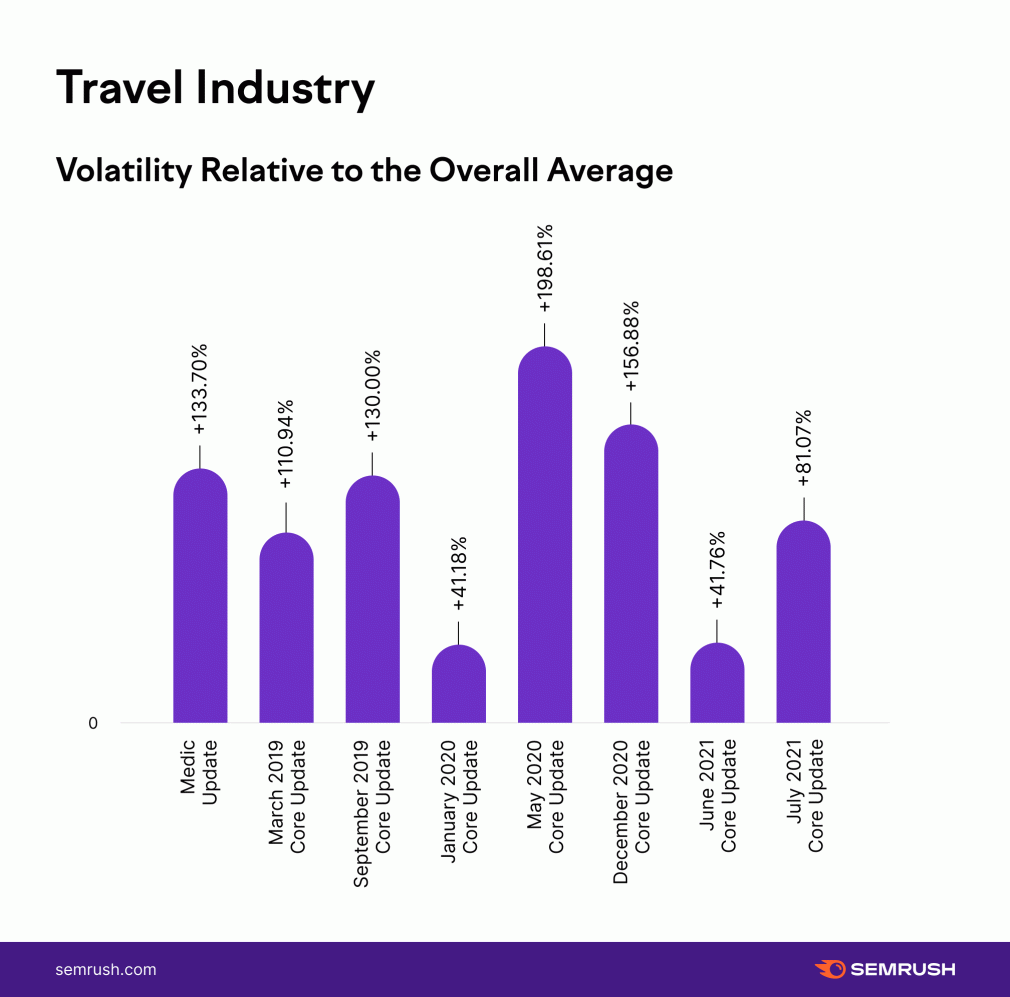
However, two of the times that it has not reached such levels of volatility came during the June and July 2021 Core Updates. The third instance was during the January 2020 Core Update, where the niche was just 41% more volatile than average.
Still, during the July 2021 Core Update, the industry was far more volatile than average (87% more to be specific).
The same inconsistency can be found within the Books and Literature industry, which again I chose because it correlates very heavily with entities. There are massive swings between the industry displaying above average as well as significantly below-average volatility.
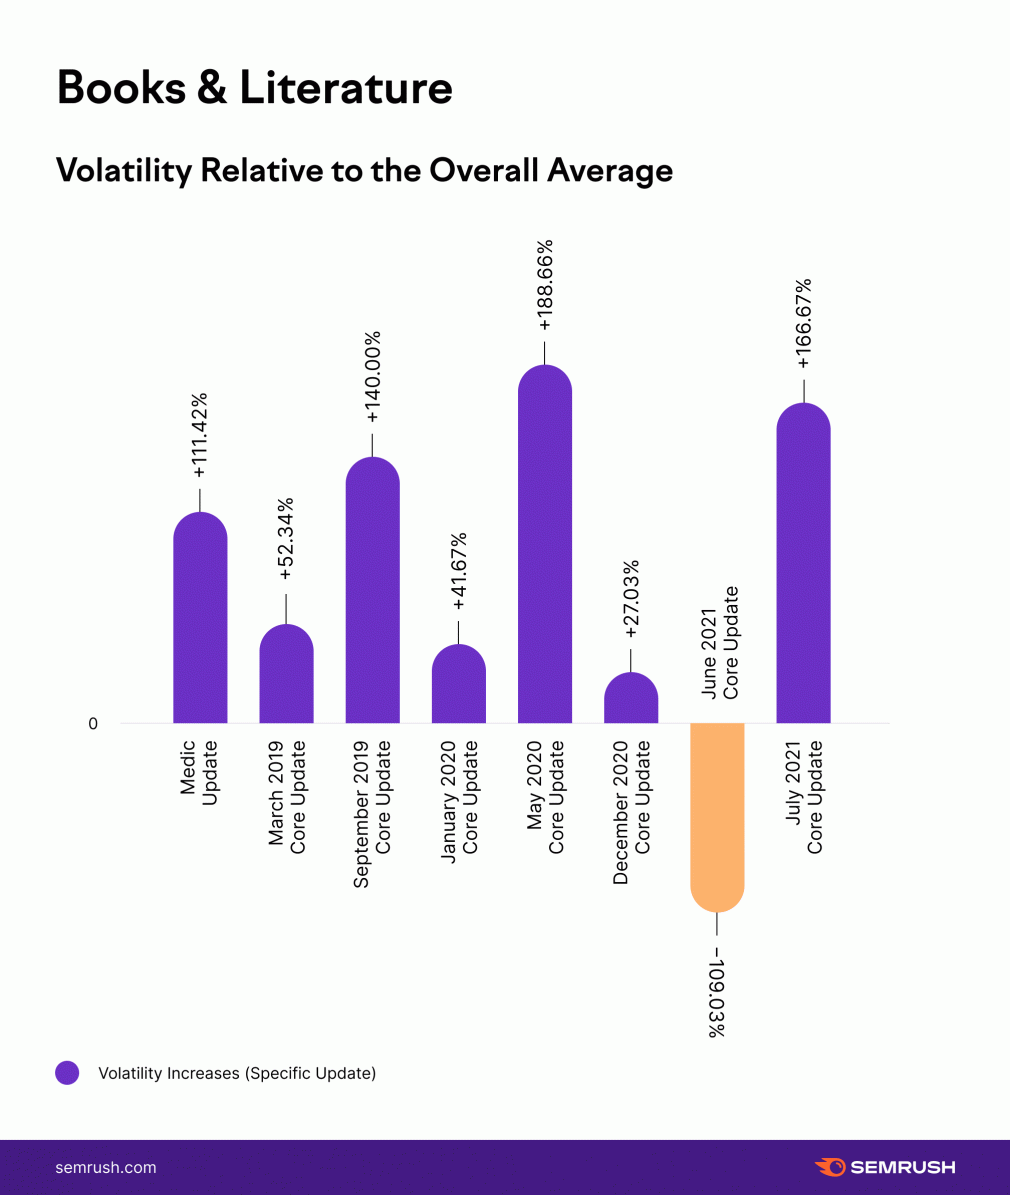
The point is, the overall trends pointing towards lesser volatility do not apply across the board. It is entirely possible that an update will display far more volatility within a given niche despite the overall trends to the contrary. Less volatility, should it be the case, certainly does not apply across the board.
Niche Industry Consistency Across the Core Updates
As the data shows, specific industries behave differently. There is no universal pattern behind the core updates. However, that’s not to say there hasn’t been consistency among the various industries over time.
For example, to the exclusion of the July 2021 Core Update, the Home and Garden industry has always displayed less rank volatility than the average niche.
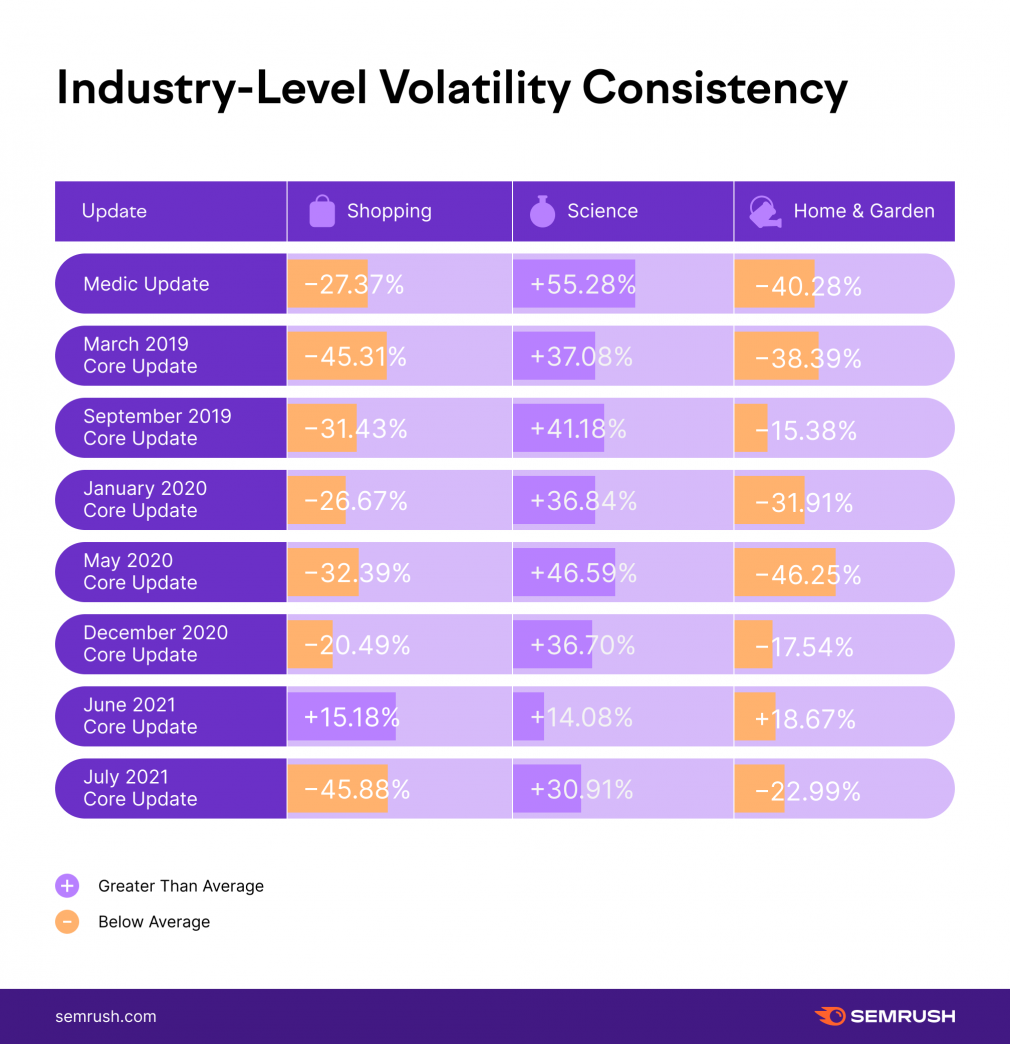
The Science industry (which I included as it reflects informational content well) always displays volatility that’s “a bit” higher than average. In fact, outside of two examples, it’s between 30% – 40% higher on average.
The same is true for the Shopping niche, which outside of the June 2021 Core Update, is generally less volatile than the average and generally in the 20% to 30% range. As an aside, this is clear testimony to the fact that despite retail shopping being YMYL, the algorithm treats it differently than something like health content. This makes total sense as shopping sites are YMYL, not because of the content per se, but because checkout requires a credit card.
The point is, the inconsistencies across industries are peculiar to each industry as each behaves according to its own trajectory.
Why Might Core Updates Be Less Powerful Than Previously?
Something changed. The modern era of core updates represents a dramatic change in the algorithm. That change is surely the subject of great debate. In my eyes, it’s been about Google getting far better at understanding the content on a page and site qualitatively, which aligns with numerous advancements in natural language processing and so forth.
To me, and to many others in the industry, there’s been a clear shift in what Google is able to do when it comes to understanding a site. A lot of what I’ve seen has been about Google being better able to profile a site’s identity and therefore understand what falls within the site’s scope and what doesn’t (and if the site lives up to its purpose). There have been instances where I’ve seen the updates pick out wording that conveys the wrong “tone” as well as cases where relevancy became far more nuanced (to the demise of some “ultimate guides”).
However you want to understand it, clearly something has changed since circa the Medic Update.
It’s then quite logical that the first applications of this change be the most impactful. (Which, Looking at the data, they have been in the form of the Medic Update and the September 2019 Core Update.) With the first application of a “new ability,” there is just simply more to fix. As time goes by and Google has applied its new abilities to more sites and pages in all-new ways, the overall impact should, in theory, decrease exponentially. (This is not a new pattern and has been seen with things like RankBrain in the past.)
Simply, the changes needed for the rankings are less drastic as Google applies the “fix” on more occasions.
That’s not to say that Google is not improving on what it can currently do. Of course, Google is.
What I am proposing is that 2018 represents a shift in what Google can and cannot do fundamentally. This fundamental change can and has been refined over time, but until another fundamental shift comes around, the impact of these updates will stabilize over time (more or less).
While more interactions of new core updates would help determine if the current trend is indeed a truly concrete pattern, there is already a great deal of logic behind what we’re seeing thus far.
The Calm Before the Storm?
I think there’s a general underemphasis on knowing what the current ecosystem on the SERP looks like. If what the data has shown thus far holds, it could mean we’re undergoing what’s set to be a uniquely calm period within SEO. (I would say to enjoy the calm, but such a statement is completely ironic in many ways as “stability” is very much relative and meaningless to a site impacted by an update).
Already, however, one could say that any relative calm won’t last very long, all things considered. Google has already applied MUM to the real world, which on its own could fundamentally change the SERP. At the same time, who knows what Google has up its sleeve as it continues to experiment with insanely complex learning models?
