
To put it simply, a dimension is an attribute of data. For example, the “City” dimension tells you the city in which a session originated.
Dimensions are a key part of your Google Analytics report that lets you know more about your users and their needs. In this article, we’ll walk you through how to use these insights to boost your online strategy.
What Is a Dimension in Google Analytics?
A dimension in Google Analytics is an attribute of data. By taking the time to look at your dimensions in more detail, you can learn a lot about your users, including where in the world they’re based, the language they speak, the device they use to access your site, and much more.
Knowing this information helps you know who you should be targeting with your digital marketing and who your core audiences are. Some examples of dimensions are:
- Source/Medium
- Campaign
- Page
- Products
- Browser
- Country
- Language
- Device Category
To put it practically, this means that if a 30-year-old American woman visited your site on a computer via an ad she saw on Twitter, your dimensions on Google Analytics would look something like this:
- Gender: Female
- Age: 25-34
- Country: USA
- Source/Medium: Twitter
- Device Category: Desktop
The default dimensions in Google Analytics can be organized into different categories. Here are just a few examples:
A full list can be found in the Google Analytics Dimensions and Metrics Explorer.
What Do Dimensions Look Like in Google Analytics?
Dimensions show up in the first column of your Google Analytics report. They’re not to be confused with metrics, which are the quantitative measures of the dimensions and appear in the following columns.
So, typically, your Google Analytics table will look something like this (we’ve highlighted the dimension column for you):
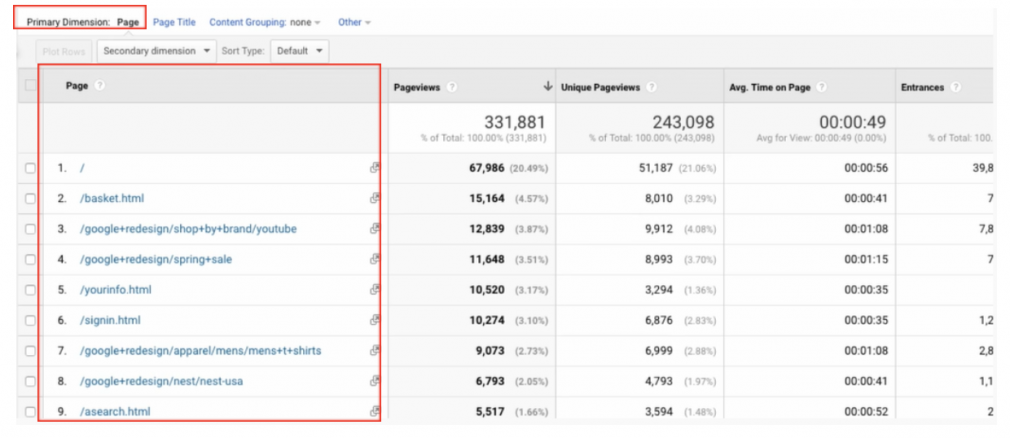
As you can see in the top left corner, the primary dimension in this table is ‘Page’, which is also the left-most column. Your web pages are listed in this column.
Then, in the following columns, Google elaborates on the metrics for each of these pages, showing you your pageviews, unique pageviews, average time on page, and entrances.
The benefit of this system is that you can filter your metrics by dimensions and easily see those facts that are most interesting, important, or relevant for your site.
Primary & Secondary Dimensions in Google Analytics
When you work with one default dimension applied automatically to a Google Analytics report, it’s also known as working with a primary dimension. As you can see in the screenshot above, the primary dimension is “Page”.
However, you don’t have to work with just one dimension.
You can add secondary dimensions to narrow your results. Using a secondary dimension will give you a more detailed view of your data and break it down even further.
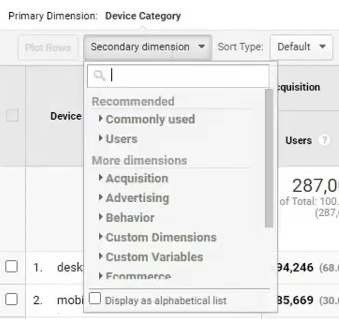
To apply a secondary dimension, all you have to do is click the “Secondary dimension” button.
And then select the dimension you’d like to analyze. You can choose one that’s recommended in the drop-down list…
or search for something you have in mind:
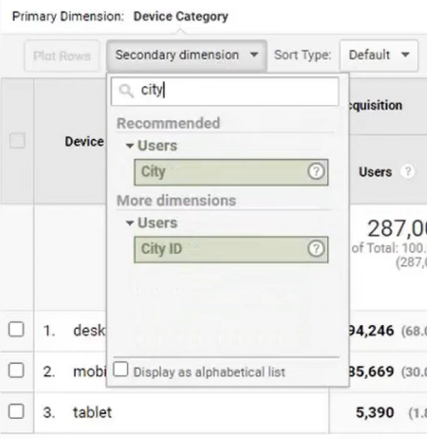
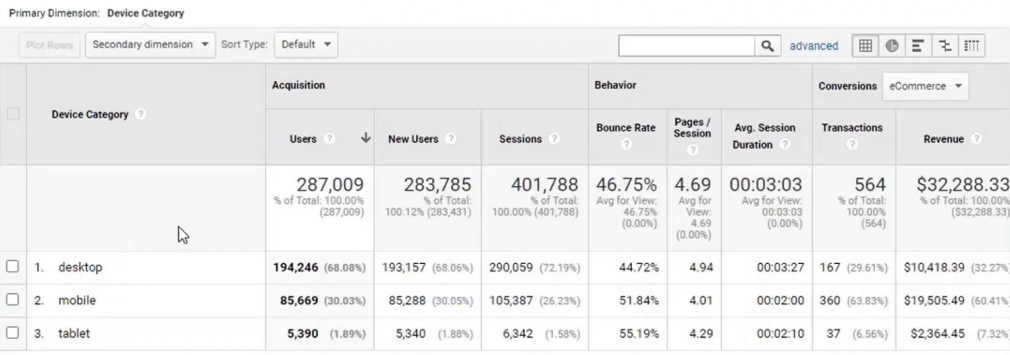
The secondary dimension you choose will appear in another column to your table. In our example below, “City” appears between “Device Category” and “Acquisition”:
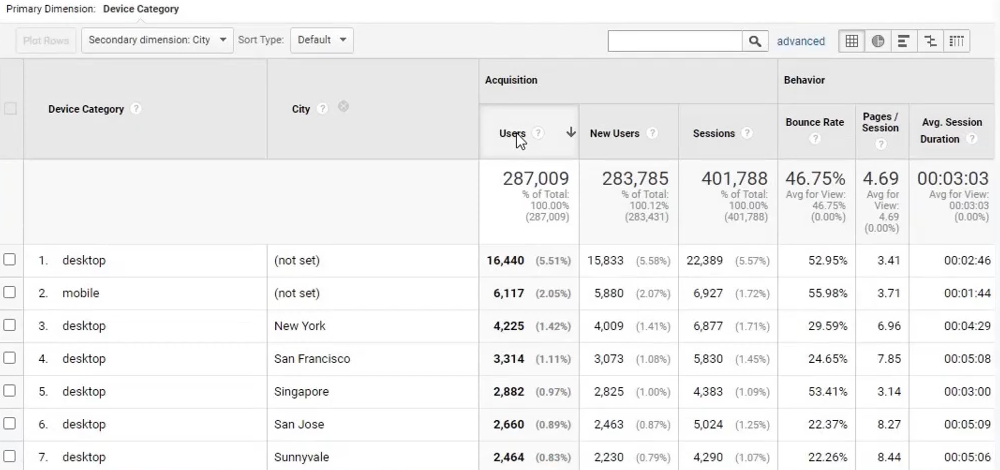
The “Device Category” column still lists different devices, but the addition of the second column includes more information about where these devices are most often used.
By including a secondary dimension, you get much more information on how certain users interact with your site and a much better idea of who you should be targeting and where. If you want to focus your marketing to get more desktop visitors, for example, you might concentrate on San Jose; clearly, your efforts are paying off in New York.
There are literally hundreds of dimensions to explore. Luckily, changing and adjusting them isn’t too difficult. As we’ve already explored, you can click on “Other” in the primary dimension menu to scroll through a full list of primary dimensions and choose one at will. You have the same amount of choice with secondary dimensions.
What Are Custom Dimensions & How Do You Create Them?
Another option you have as a Google Analytics user is to use custom dimensions. This allows you to work with data that the tool doesn’t keep track of automatically and focus on the dimensions that really matter to you — how individual authors are performing, the categories that perform best, the tags that bring the most traffic, and more.
To create custom dimensions, you’ll need permission to edit on the property you’re working with. Once you do, creating them is simple.
- Sign in to Google Analytics
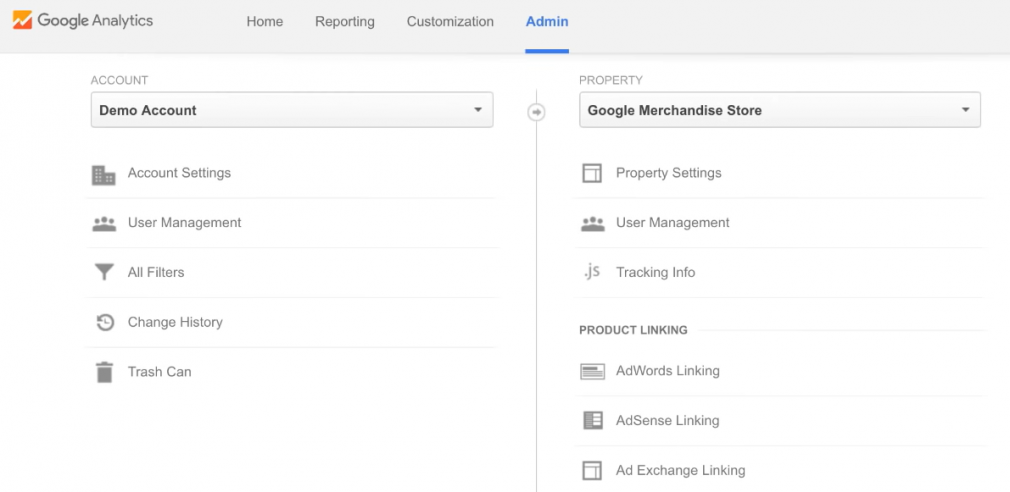
- Go to Admin, find “Property”, and then select the property you want to work with from the drop-down menu:
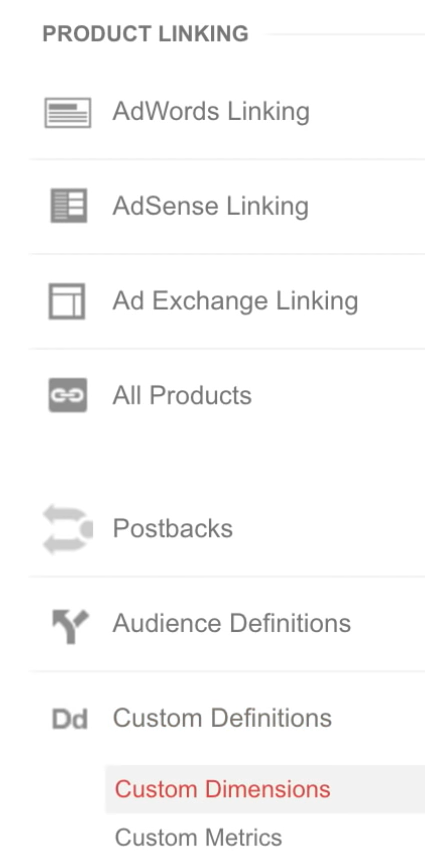
- Select “Custom Definitions” and then “Custom Dimensions”:
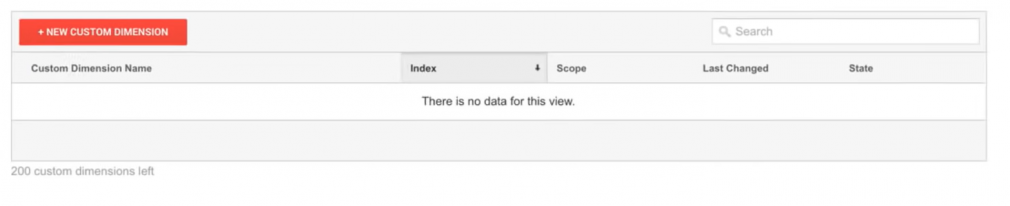
- Click “New Custom Dimension”:
- Name your new custom dimension:
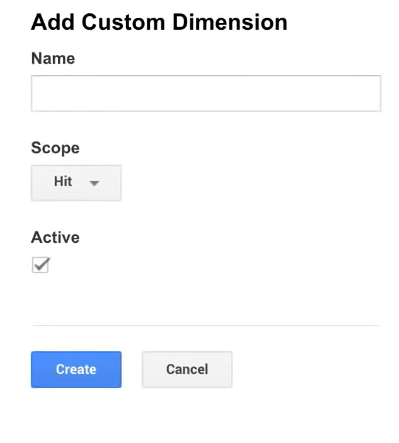
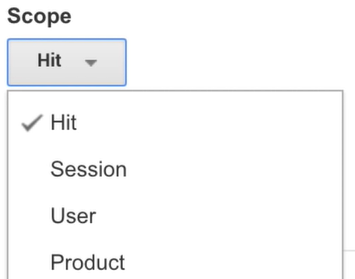
- Choose your scope (decide whether to track by Hit, Session, User, or Product):
- Check the “Active” box to activate your dimension:
- Click “Create”!
Semrush’s Integration with Google Analytics
Google Analytics is a really useful internal tool to help you understand user behavior on your site. However, there are many tools within Semrush that allow you to analyze your own website alongside your competitors.
Once you’ve done your site comparison in Semrush, you can also create campaigns, write content, track results, and create custom reports. It’s a great add-on to what you already know and love about Google Analytics.
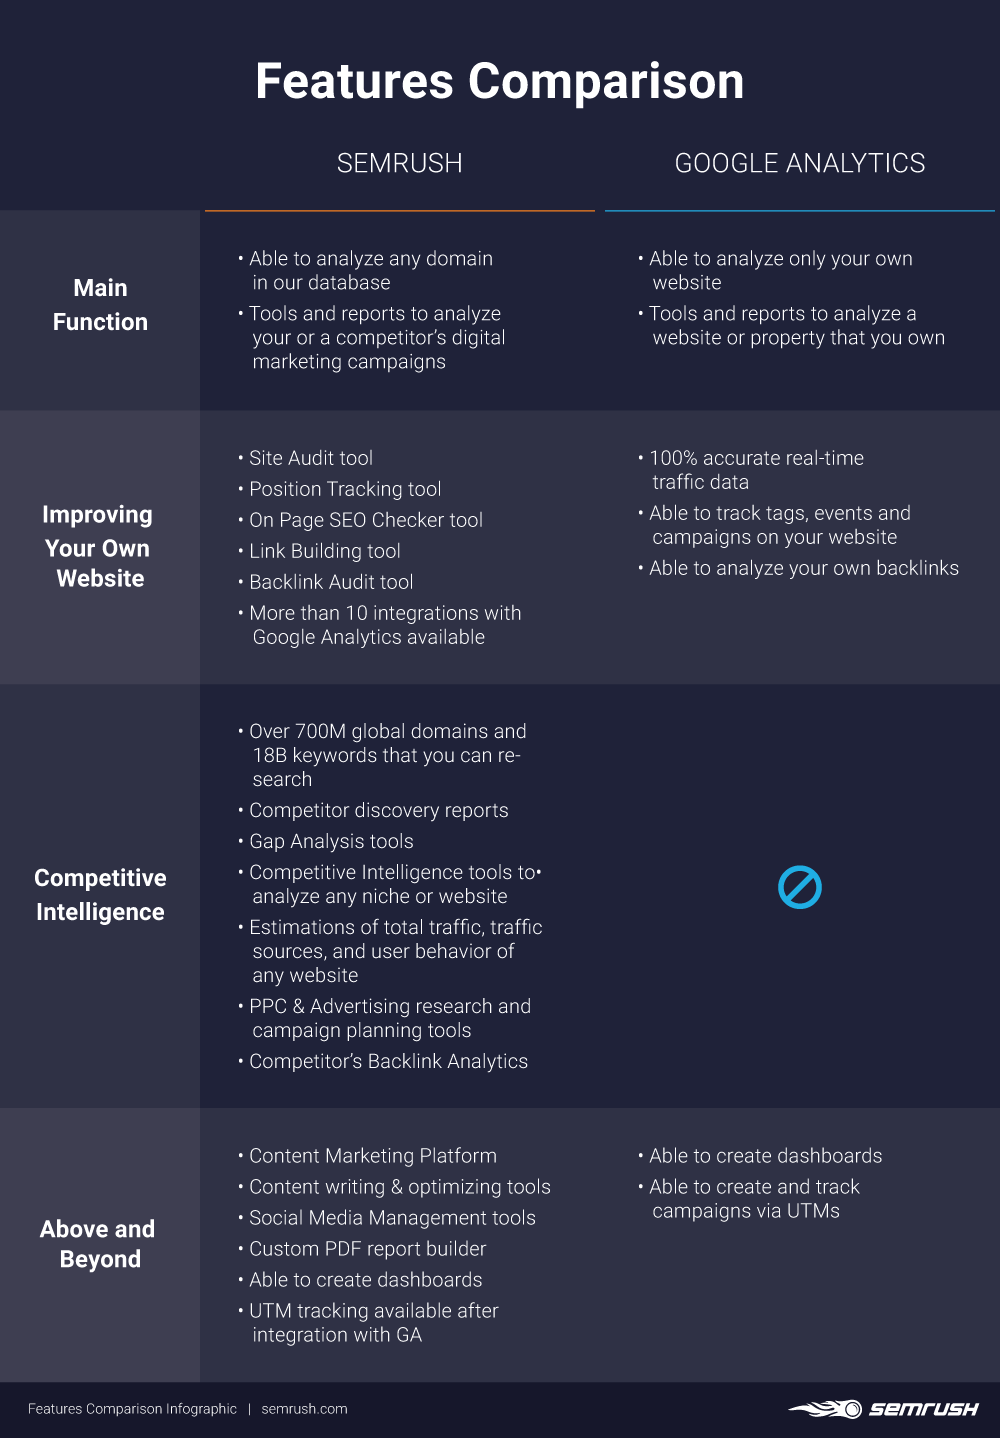
Integrating your Semrush account with Google Analytics is something we highly recommend. This will allow you to analyze all your site data in one location: the Semrush user interface.
There are loads of Semrush tools that work with Google Analytics, including:
- Position Tracking
- On Page SEO Tracker
- Backlink Audit
- Organic Traffic Insights
- My Reports
- Site Audit
- Content Analyzer
- SEO Dashboard
- Brand Monitoring
- Marketing Calendar
But what can they help you with? We’ll explain.
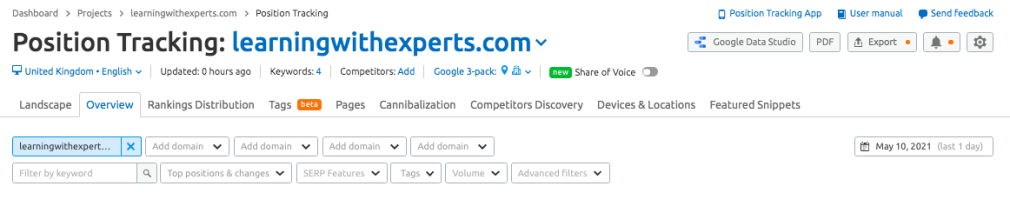
Position Tracking
The Position Tracking tool is the best way to measure visibility, traffic, and your page’s average ranking for your selected keywords. When you pair your Position Tracking with Google Analytics, you’ll be able to access additional keywords.
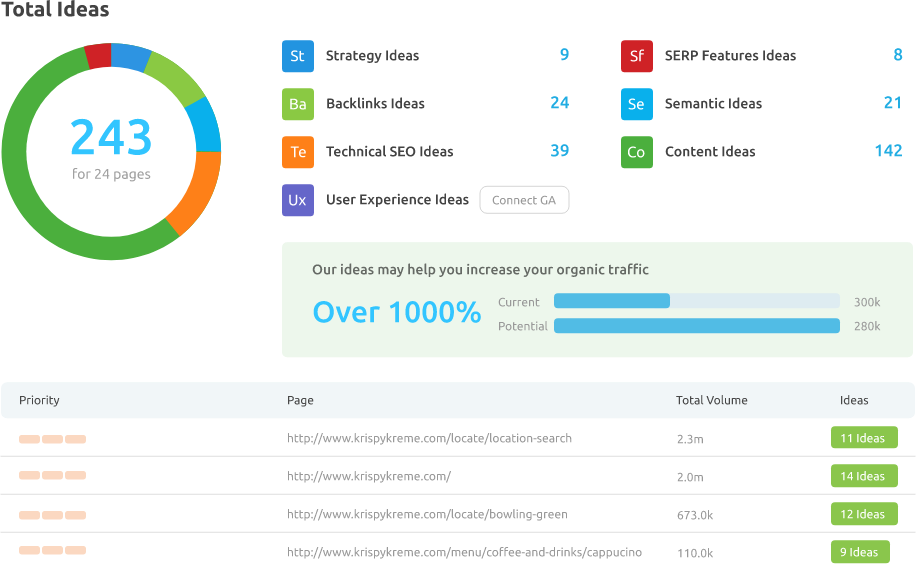
On Page SEO Tracker
The On Page SEO Tracker connects with Google Analytics to show you stats like your bounce rate, time on page, and page load time. It’ll also give you more info on page and user experience and perhaps inspire where you can optimize your site further!
Track Your Ranking with Ease
with the Position Tracking Tool

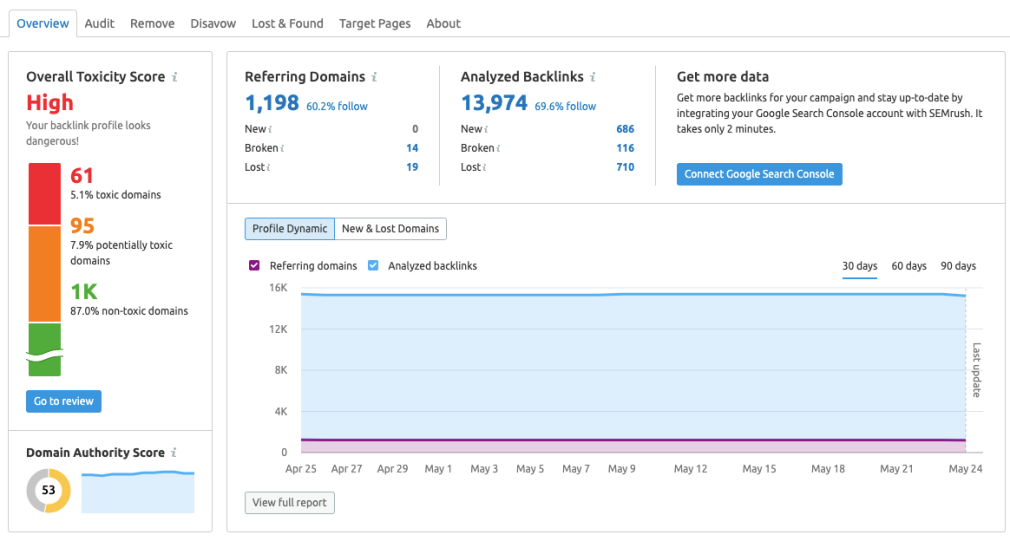
Backlink Audit
When linked to the Backlink Audit, Google Analytics provides referral traffic information. Additionally, the tool will recalculate your Toxicity Score based on the traffic received.
Organic Traffic Insights
Want even more insights from your Google Analytics account? Connect it to the Organic Traffic Insights tool. This will add extra data, such as info on your bounce rate and goal completions as well as additional keywords.
My Reports
Connect Google Analytics to the Reports tool to add your Google data to your custom PDFs. An added bonus of this combo is that you can add Google tool widgets to your reports to make them as relevant as possible. The widgets that we currently support include:
- Overview
- Metrics Charts
- Top Traffic Channels
- New vs Returning Visitors
- Conversions (Ecommerce)
- Top Page Views
- Goal Completions Chart
- Location
- Language and Source/Medium
- Referrals
Site Audit
Connecting your Google Analytics account to your Site Audit makes it even better, adding pageviews and two other checks:
- Pages that take longer than one second to become interactive
- Orphaned pages
Prioritize your pages more effectively and sort by pageviews to see the most popular pages with the worst issues and know which pages to add links to and which pages may be lacking in terms of page speed.
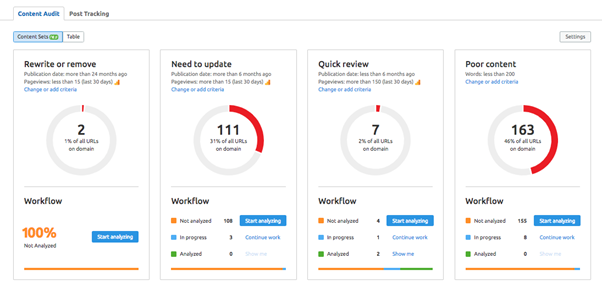
Content Analyzer
Connect Google Analytics to your Content Audit to see the most up-to-date information, including your article data. It’s the easiest way to see the popularity and performance of the different pages you’re auditing.
You’ll be able to view bounce rate, pageviews/sessions, time on page, and session duration.
SEO Dashboard
The SEO Dashboard is helpful because it brings all your site search performance together in one place. Pairing with Google Analytics adds real-time data to your existing dashboard, including data on:
- Visits
- Unique visitors
- Pages/visit
- Avg. visit duration
- Bounce rate
- Geographic distribution and visits trend
- A line graph to view trends of top-level metrics (users, sessions, bounce rate, etc.)
- Goal completions
- Top pageviews
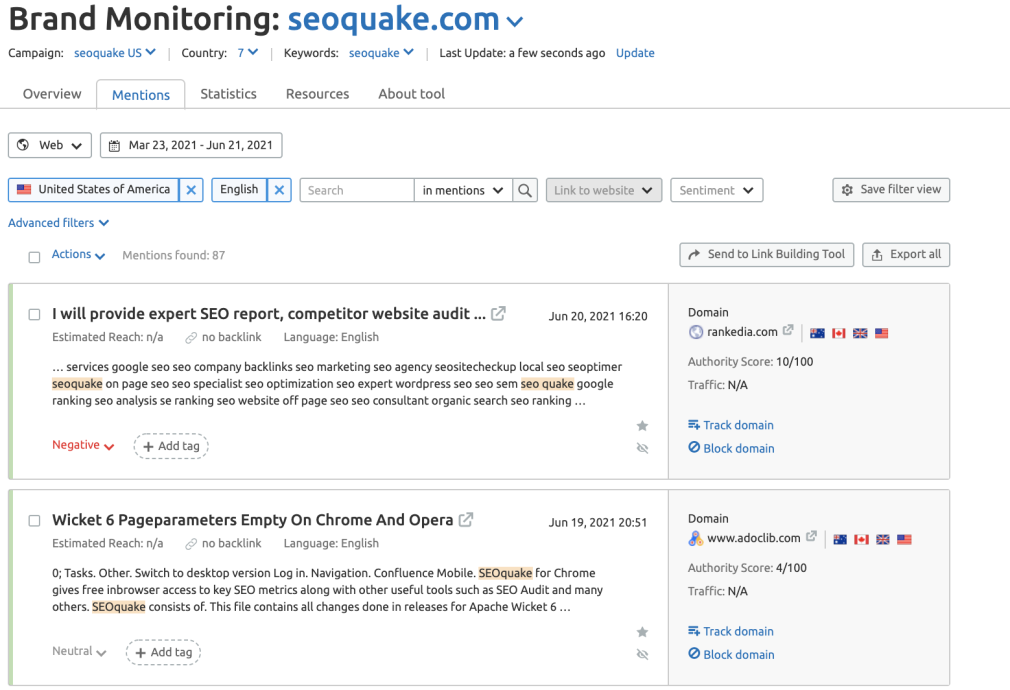
Brand Monitoring
Connecting Google Analytics to Brand Monitoring tracks your referral traffic from branded mentions, giving you even more info on where your traffic is coming from.
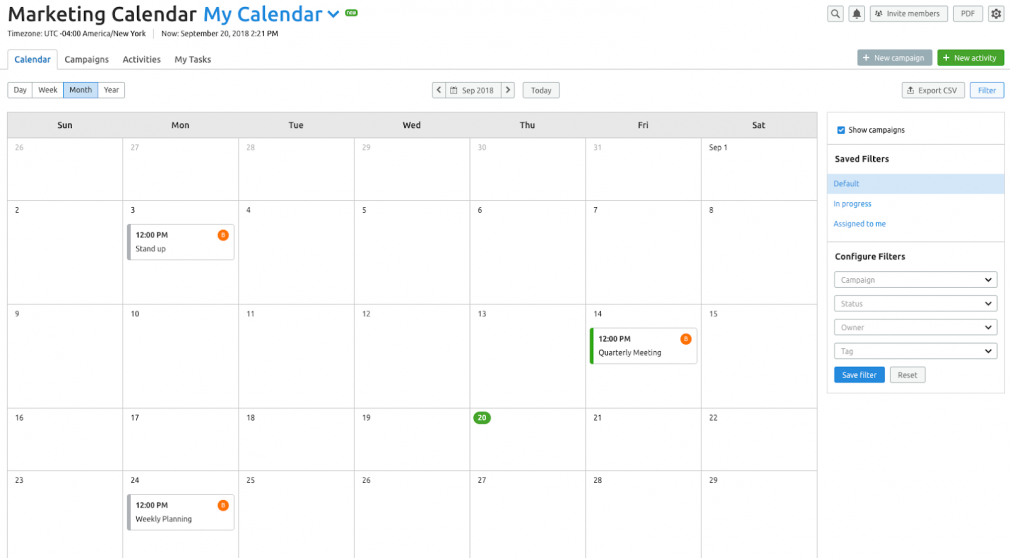
Marketing Calendar
Finally, connect Google Analytics to your Marketing Calendar to add UTM tags to your campaigns and track how they perform.
Get Started with Semrush & Google Analytics
Now you’re all up to speed on Dimensions in Google Analytics and the valuable insights they can bring. Be sure to check out in more detail all the ways connecting Google Analytics with various Semrush tools can bring your online strategy to the next level in these guides below:
Start getting the most out of Google Analytics dimensions today!
