
Using Google Analytics can help you drive more traffic, refine your users’ experience, and track your business goals. But with so much data available in Google Analytics, how do you know which metrics to track?
We’ll share some standard metrics to monitor with the Google tool.
What are Metrics in Google Analytics?
Google Analytics collects data about your website and its traffic in real-time. The tool displays this data in a collection of reports, each with widgets set to track specific metrics and dimensions.
According to Google, metrics are “individual elements of a dimension that can be measured as a sum or a ratio.” They’re quantitative measurements of the data Google Analytics tracks. Metrics in Google Analytics include:
- Sessions
- Session Duration
- Conversion Rate
- Goal Completion
What’s the Difference Between Metrics and Dimensions in Google Analytics?
By contrast, dimensions are non-numerical, qualitative data. You can think of them as “categories.” Google Analytics uses them to organize the data it collects. Dimensions in Google Analytics include:
- Medium
- Country
- Campaign
- Device Category
Useful Metrics In Google Analytics
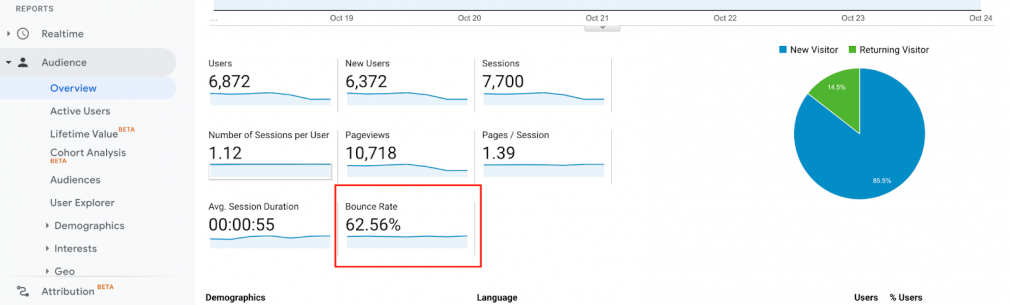
1. Number Of Users
The user metric represents the number of people who visit your website. 1 user represents 1 website visitor.
However, if one person visits your website from their desktop and mobile, Google Analytics considers these 2 different users. Google does try to use cookie data to eliminate this problem but isn’t 100% accurate.
You can view your user data by navigating to Audience > Overview from the tool’s main menu. You will also see the number of users metric appear in other reports.
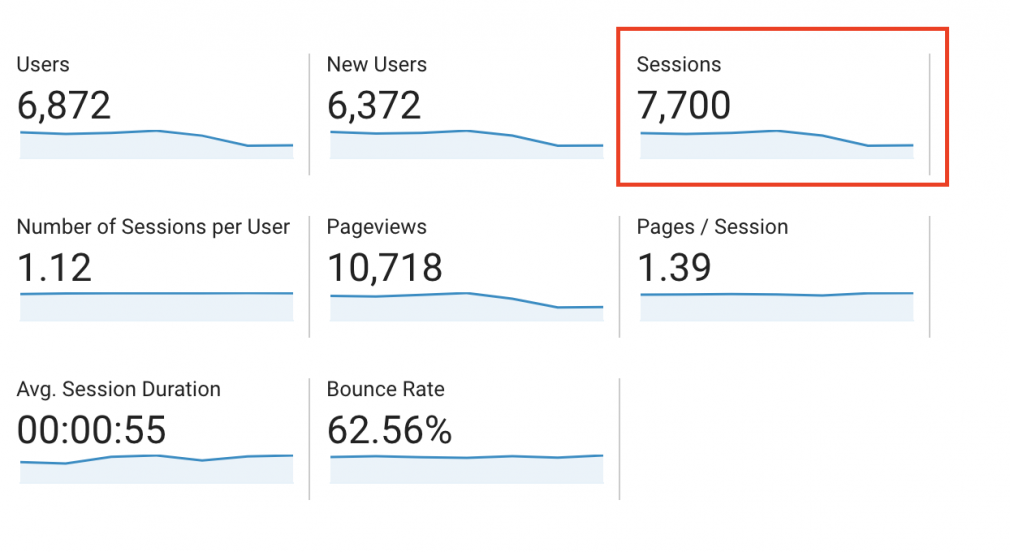
2. Number Of Sessions
While users represent visitors, the sessions metric indicates how many times people land on your website. For example, you can earn 10 sessions from 2 users if each user visited your website 5 times.
Sessions are an excellent metric to track if you want to gauge how actively engaged visitors are with your website.
You can view your session data in the Audience > Overview section of your Google Analytics account. This metric also appears in other reports.
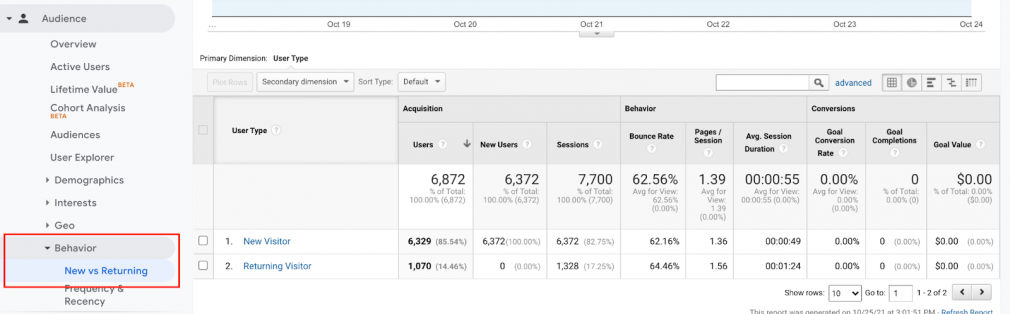
3. New Users
Tracking your new users can help you understand where your traffic comes from and whether your brand awareness campaigns work. The new users metric only tracks users that have never landed on your website before.
You can spot your new users n the Audience > Overview section of Google Analytics. For more detail on your new and returning visitors, toggle the New vs. Returning report under Audience > Behavior.
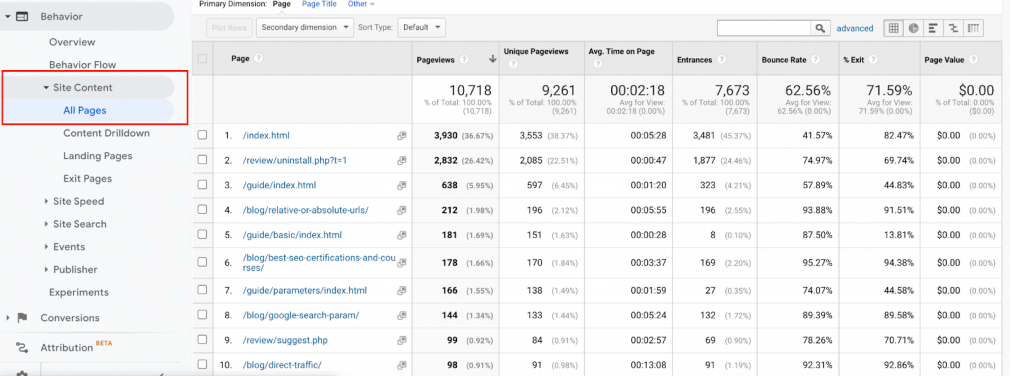
4. Average Time On Page
“Average time on page” tracks how long a visitor stays on your website before they leave. You can use this metric to understand how (or if) visitors are actively browsing your website.
You can view your overall average time on page under Audience > Overview. However, for greater insight, you can also get the average time on page data for individual pages under the All Pages report (Behavior > Site Content > All Pages.)
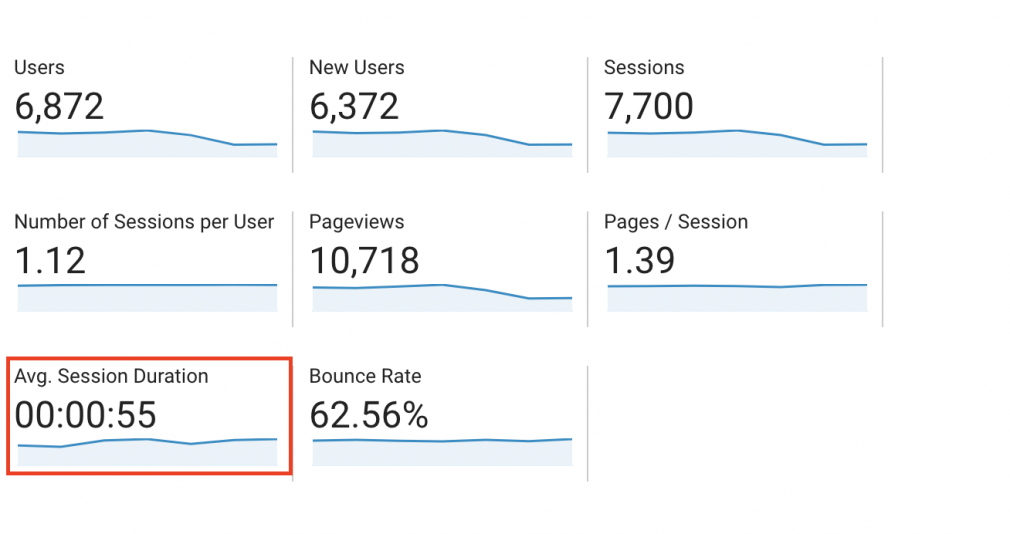
5. Average Pages per Session
Monitor the average number of pages your visitors browse per session to track how users engage with your site or any issues in your user’s journey. If this number is on the lower side, it could indicate that.
This metric usually appears as “Average Session Duration” in the Audience > Overview section of Google Analytics.
6. Bounce Rate
This metric tracks when users visit one page of your website and then leave. Google Analytics displays the bounce rate in a percentage format. For example, a site with a 50% bounce rate from 50 users means that 25 did not click onto another page.
You can view your overall site bounce rate under the Audience > Overview report. You can also see the bounce rate of individual pages, channels, or campaigns.
7. Conversion Rate
If you own an e-commerce, lead-gen, or content website, you will have an end goal that you want your users to reach. It could be a sale, a submission form completion, or a content download. Whatever your goal, you can use the conversion rate metric to help you track it.
Google Analytics allows you to define your goal to use the conversion rate metric. You can then use the metric to understand how many of your visitors are completing the target objective.
By monitoring your conversion rate over time, you can understand how campaigns and incentives are working and identify any problems that you can work through.
You can see your overall site conversion rate under Conversions > Goals > Overview. However, you will need to set up your goals first in Settings > View > Goals first.
Other Metrics in Google Analytics
Among the many metrics available to track, a few can often be confused and used interchangeably. For example:
Clicks vs. Sessions
These metrics may seem similar, but they track very different data.
Clicks is a metric that appears on some Google Analytics reports, like channel reports for Organic and Paid. This metric tracks how many people click on your listing or ad. Sessions track the total number of visits to your site.
Goals vs. Events
In Google Analytics, users’ goals are actions taken on your site that achieve your overall business goal. Goals can be revenue in sales, sign-ups, or downloads.
Events are other user interactions that contribute to the business goal. Events include button clicks, add to basket, and similar page interactions.
Pageviews vs. Unique Pageviews
While these metrics are somewhat related to each other, they are still quite different. Pageviews track the total number of times that any user viewed a page. If a user views the same page twice, Google counts it as 2 pageviews.
By contrast, unique pageviews count the number of users that viewed the page. If a user views the same page twice, Google considers it to be 1 unique pageview.
How Many Metrics Should You Track?
Any of the metrics listed here can help you monitor website performance. They work best with each other but not in isolation.
However, the number of metrics to track depends on various factors, like your business goals, strategy, stakeholders, and more.
For example, if you want to understand how users interact with your website, you might track users, average time on page, bounce rate, pages per session, and conversion rate.
However, if you want to monitor sales during a marketing campaign, you might track sessions, conversion rate, and revenue.
Here is a breakdown of which metrics are most useful for acquisition, behavior, and conversion.
Acquisition
If your goal is to understand how your visitors found you and where they came from, you can use the following metrics under Acquisition > All Traffic > Channels:
Behavior
If your goal is to understand what users are doing on your website and what pages are working, you can use the following metrics under Behavior > Site Content > All Pages:
- Bounce Rate
- Pages Per Session
- Average Time On Page
- Conversion Rate
Conversion
If your goal is to understand how many users converted or how much revenue you earned, you can use the following metrics:
- Ecommerce Conversion Rate
- Transactions
- Revenue
Other Ways to Track Website Performance
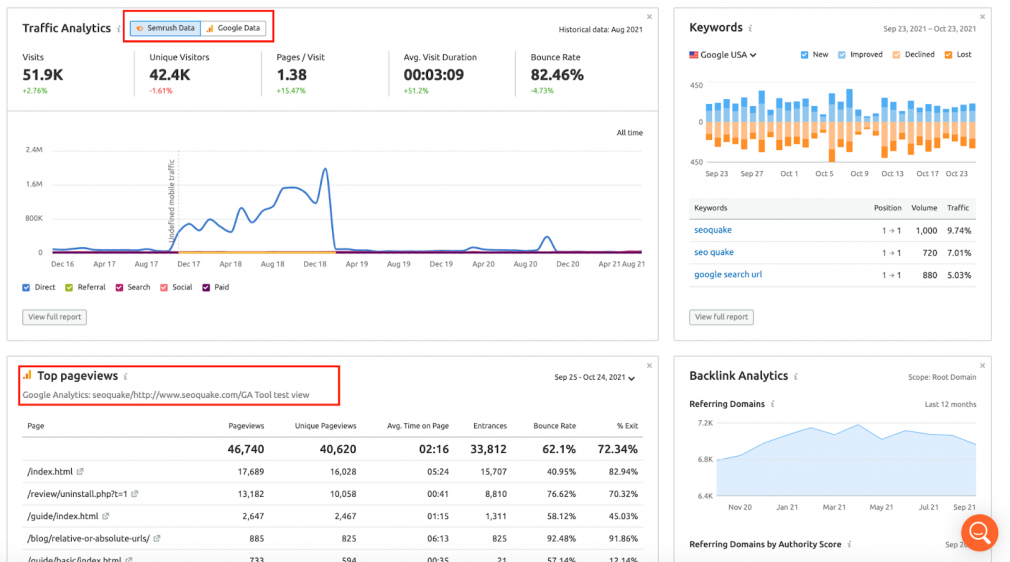
Google Analytics can surely help monitor your metrics, but it won’t always work in isolation. Many business owners integrate Google Analytics with a third-party tool to comprehensively track campaigns or website traffic.
Integrate Google Analytics with Semrush to combine your standard Google Analytics data with our suite of SEO, analytics, advertising, content, and competitor research tools.
Plenty of standard Google Analytics metrics can be tracked in Semrush once integrated, including Pageviews, Unique Visitors, Pages per Visit, Bounce Rate, and more. Just toggle to “Google data” from your SEO dashboard. The integration also enables you to view your top pageviews data:
Access All of Your Data
with the SEO Dashboard

Conclusion
Google Analytics can be handy for monitoring your website’s performance when you determine which metrics you need to track. Remember, each metric you track should reflect your business goal.
For an even more detailed dashboard, you can integrate Google Analytics with a few third-party tools so you always have a comprehensive view of your website’s traffic.
