If sales and leads are what our leadership teams, whether internally or externally, care most about, what does this mean for PPC marketers?
Such preferences can lead to a level of expectation that marketers are going to create a magic sales faucet, a fountain of fortune, or that there’s a secret Google leads button hidden in our toolbox somewhere. And hey, PPC marketers can help make some pretty magical things happen, but we’re definitely not magicians, at least not in the Gandalf the Grey or Albus Dumbledore kind of way.
There can also be a limiting belief that there is no value in marketing components and efforts that don’t have a direct correlation to exact dollars, and by some sort of wizardry, it’s somewhat expected a visitor will just magically appear on a business’s website and then (poof) become a customer. Such bloated misunderstandings of reality are great examples of expectations that may lead to conversations where we hear things like “Facebook doesn’t work”, “We just want the most bang for our buck”, and “Focus only on low funnel”.
Expectation vs. Reality

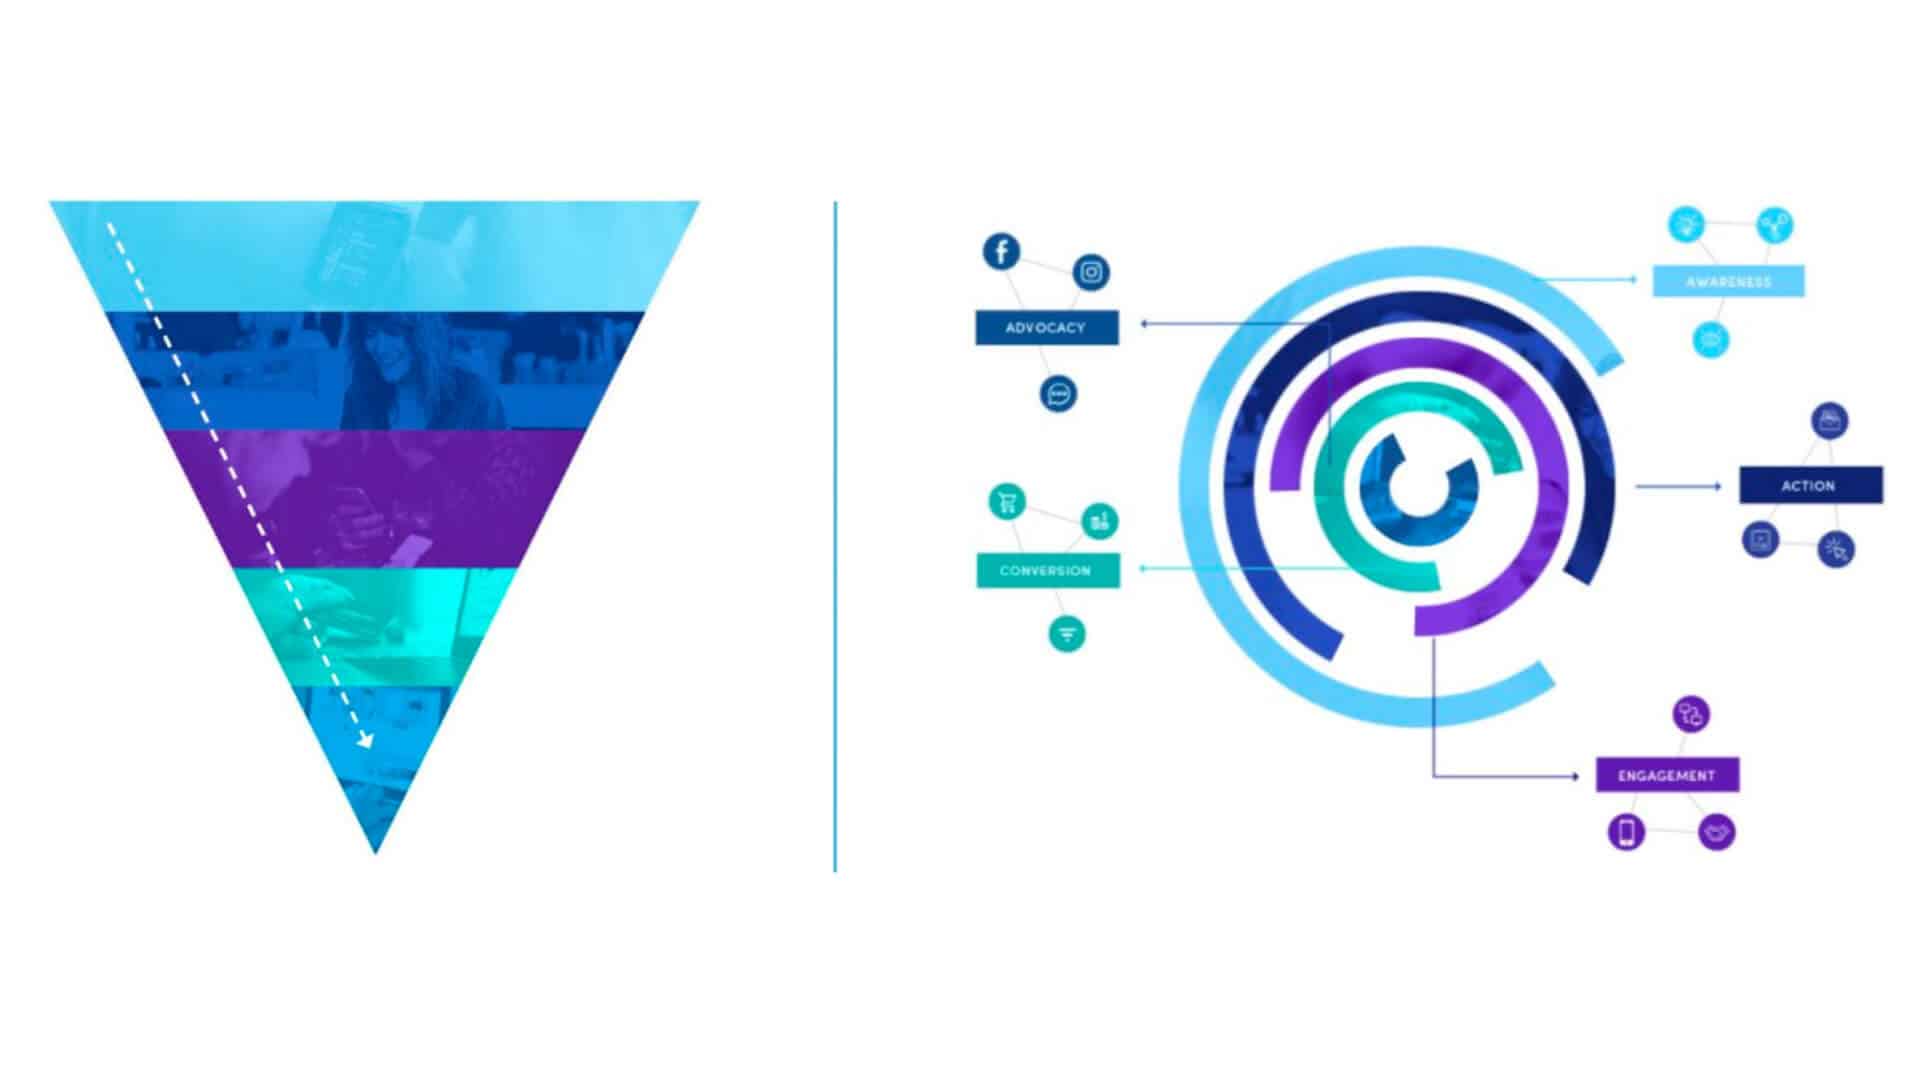
Most consummate marketers know consumers are not mythological robots that you one simply puppet into a magical fountain of money. In actuality, consumer behavior is the farthest thing from linear, constantly evolving.
Understanding customer journey for reporting
We know customer journey is a complex process but getting a baseline understanding can positively impact our marketing reporting and data measurement. Start by asking: What data do we know? What is assumed based on what we know?
Why customer journey matters: When as marketers and their stakeholders we scrutinize reporting needs we can then attribute longer timelines to different types of attribution models. Studying marketing reports does not need to be perfect math but conceptual understanding can improve cross-channel performance attribution and understanding of what marketing tactics are driving success within your reporting funnel.
- What is our customer lifetime value?
- What is our average customer retention?
- What is the typical sales timeline to close?
- What is our average order value?
Additional Considerations: Emotional investment of the purchase, the purchase price (average buyer’s journey for purchasing a yacht is 5 years), timeliness (is this something that is urgent they need to purchase or is there risk in making a quick purchase).
The more your customer value and complexity of purchase is, the more challenging it can be for reporting and data management. More fastidious use of data can also help teams overcome the “Facebook doesn’t work for sales” argument when you can show longer attribution and the multiple touchpoints of your customers.
Set up reporting and get to what matters
Here is a list of questions you can ask to get started on wrangling the data and reports that are going to matter most for your teams and stakeholders.
Who are the reporting stakeholders? Who needs to see the data? What do they care about?
There is so much time wasted when you are constantly making changes to marketing reports. One classic method to limit marketing report spew and churn is to segment who your key reporting audiences are and create dashboard views and reporting formats specifically tailored for reporting consumer segments. Think of it like audience targeting with summary data.
Understanding what matters to each stakeholder’s role involved in the reporting process is crucial for success: marketers, executives, sales teams and other stakeholders.
- What business questions do we want to try to get answers to?
- What questions do you need to answer for executives?
- What reports are you using today? Where do they come from?
- What questions are you asking today that you wish you had answers to?
- Are there any dots you are hoping to connect?
As we start mapping reporting frameworks it’s important to determine success criteria, and what success looks like at each level of the organization: business, brand, and marketing. This will help define not only what’s desired but also what is actually possible.

Define some common vocabulary:
Creating a report glossary can be especially important working with sales teams. Make sure said teams are on the same page with the what and how behind the categorization of certain labels. Below is an example of a sales/marketing vocabulary list:
- Contacts – New contacts added into the system (First name, last name, email address)
- Subscriber – A contact who has opted in to receive content
- Lead – Someone who has provided you more information about themselves
- Marketing Qualified Lead (MQL) – A lead that is deemed ready for marketing messages, they have deemed themselves interested in our product and services, given additional information and opted into marketing
- Sales Qualified Lead – A lead that is deemed ready for sales messages
- Opportunity – Someone who is ready to buy and ready to receive sales correspondence
- Customer – Someone who has purchased a product or service
- Brand advocate – Someone who is actively advocating for your brand
Data integration and KPIs, setting up for success
As PPC marketers, we love to talk about our access to data, reporting tools, and everything shiny that’s new in the industry. But, the reality for most geeky marketers is, in our day-to-day working lives we manage data with our hands tied behind our back in a box. Yikes!
Managing the data can be complex and most of the time dots are not easily connected. Data ambiguity exists at all levels of sizes of companies. The larger, more complex, the messier it can be. Often we have to answer questions like why and how Facebook calculates views vs. YouTube, versus what analytics is reporting, and then define if there is ROI attached.
And, the reality is this is extremely difficult at times because our foundations are sometimes flawed, nearly every system, channel etc. can be calculating things a bit differently, and the systems don’t always connect and talk to each other properly. So, what the heck do we show what we need to and report on it? Similar to getting on the same page for vocabulary, we have to determine common ground for tracking.
These are some questions to ask to get you started:
- What can we actually track (example if we can’t actually track sales, we can’t optimize for it)
- What data do we truly have? What is currently being tracked? What else is possible to track?
- What tools do we have?
- What is trackable?
- What is not trackable?
- What blind spots do we have? Are there any ways we can remove those?
- What third-party constraints exist?
- Is there anything we should not track? (Example: exclusion list for IPs, etc.)
If it’s a missed opportunity that cannot be changed, note the disconnect, put it in your reporting framework. Determine what is going to be counted as what and for where and why. If there’s a way to integrate data not currently integrated, note the omission, see if it’s possible to integrate missing data and if it’s not possible, note the short circuit and make sure all stakeholders are on the same page.
Drilling down: What to actually put in reports
What marketing process questions do we seek answers to? What is the most valuable information? What campaigns, KPIs and overall metrics do we want to measure? And does this look different for any of the below?
- What benchmarks do we have and wish to use?
- What marketing questions do we want to summarize? What elements do we need to track and measure?
- Campaigns
- Websites
- Third Party Channels or Websites
- Social Channels
- Audiences
- What else?
Once we’ve put lists together, summarize key talking points in a brief and share findings with teams and stakeholders. Give other players a chance to contribute ideas and ask questions to help alleviate changes and challenging conversations once you start generating reports.
Presentation; it doesn’t have to be fancy
Presentation is important but the style doesn’t need to be fancy. It needs to be in a way that those using the data can understand. Sometimes the best reports are simple spreadsheets or diagrams, or for C-suite, it may just be a funnel image with a few bullets on performance that make it easy to digest.
Here are some examples:
Below is a funnel report that shows an increase in lead to MQL and SQL performance for a C-Suite leadership team.

Below is a simple spreadsheet report that was created in collaboration with a sales team leader to report to a sales team using a Google Spreadsheet (the team’s preference).

Or when you need to explain digital marketing reports to someone who hasn’t done digital marketing before:

Or when you have an engaged ecommerce team who wants to report on ongoing ROAs performance. This is an automated Power BI report.

Or an ecommerce team evaluating website performance to Revenue. This is also an automated report using Power BI.

A creative team report who is running CRO testing on a website landing page that needs to improve FTD Rate (conversion rate – free trials and demo submission rate).

Iterate and test your reporting effectiveness
Find the formats that work best for you and your team. It is also a good idea to treat the first round of reports as a draft, this is a good time to get feedback or make adjustments. Once you’ve done this, it will make the ongoing reporting process easier.
Opinions expressed in this article are those of the guest author and not necessarily Search Engine Land. Staff authors are listed here.
About The Author

Amanda Farley is a marketer, performance strategist, and business success leader. She is VP of Growth at Aimclear®, a highly decorated, integrated marketing agency dominant in customer acquisition and winner of 17 US Search Awards including 5X most recent Best Integrated Agency. Aimclear’s differentiator is the balance of holistic brand-builds, PR, data, and integrated performance marketing.
