
Google offers PageSpeed Insights API to help SEO pros and developers by mixing real-world data with simulation data, providing load performance timing data related to web pages.
The difference between the Google PageSpeed Insights (PSI) and Lighthouse is that PSI involves both real-world and lab data, while Lighthouse performs a page loading simulation by modifying the connection and user-agent of the device.
Another point of difference is that PSI doesn’t supply any information related to web accessibility, SEO, or progressive web apps (PWAs), while Lighthouse provides all of the above.
Thus, when we use PageSpeed Insights API for the bulk URL loading performance test, we won’t have any data for accessibility.
However, PSI provides more information related to the page speed performance, such as “DOM Size,” “Deepest DOM Child Element,” “Total Task Count,” and “DOM Content Loaded” timing.
One more advantage of the PageSpeed Insights API is that it gives the “observed metrics” and “actual metrics” different names.
In this guide, you will learn:
- How to create a production-level Python Script.
- How to use APIs with Python.
- How to construct data frames from API responses.
- How to analyze the API responses.
- How to parse URLs and process URL requests’ responses.
- How to store the API responses with proper structure.
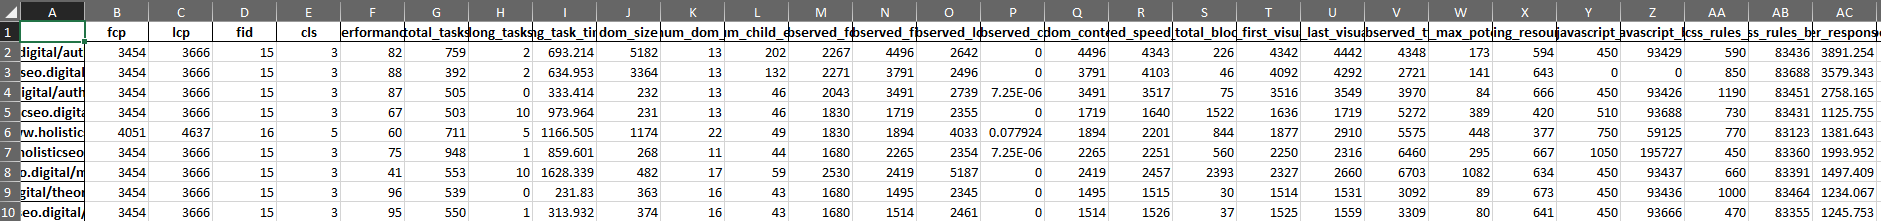
An example output of the Page Speed Insights API call with Python is below.
Libraries For Using PageSpeed Insights API With Python
The necessary libraries to use PSI API with Python are below.
- Advertools retrieves testing URLs from the sitemap of a website.
- Pandas is to construct the data frame and flatten the JSON output of the API.
- Requests are to make a request to the specific API endpoint.
- JSON is to take the API response and put it into the specifically related dictionary point.
- Datetime is to modify the specific output file’s name with the date of the moment.
- URLlib is to parse the test subject website URL.
How To Use PSI API With Python?
To use the PSI API with Python, follow the steps below.
- Get a PageSpeed Insights API key.
- Import the necessary libraries.
- Parse the URL for the test subject website.
- Take the Date of Moment for file name.
- Take URLs into a list from a sitemap.
- Choose the metrics that you want from PSI API.
- Create a For Loop for taking the API Response for all URLs.
- Construct the data frame with chosen PSI API metrics.
- Output the results in the form of XLSX.
1. Get PageSpeed Insights API Key
Use the PageSpeed Insights API Documentation to get the API Key.
Click the “Get a Key” button below.
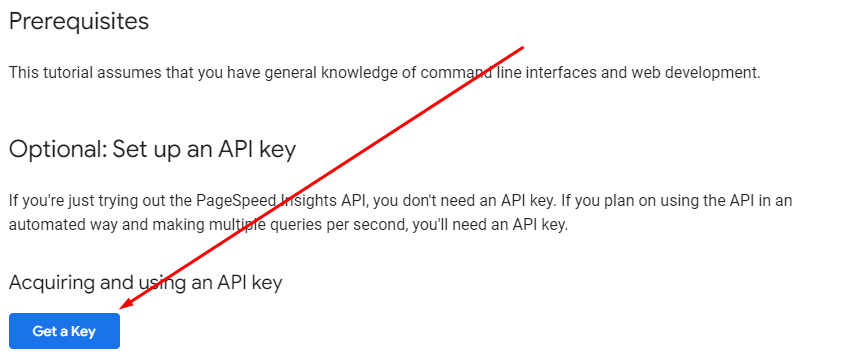 Image from developers.google.com, June 2022
Choose a project that you have created in Google Developer Console.
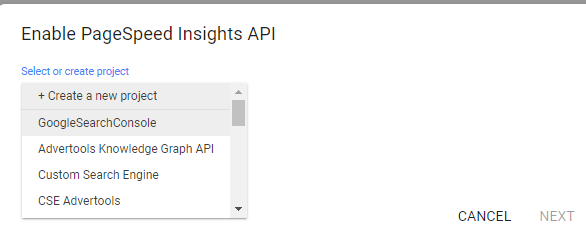 Image from developers.google.com, June 2022
Enable the PageSpeed Insights API on that specific project.
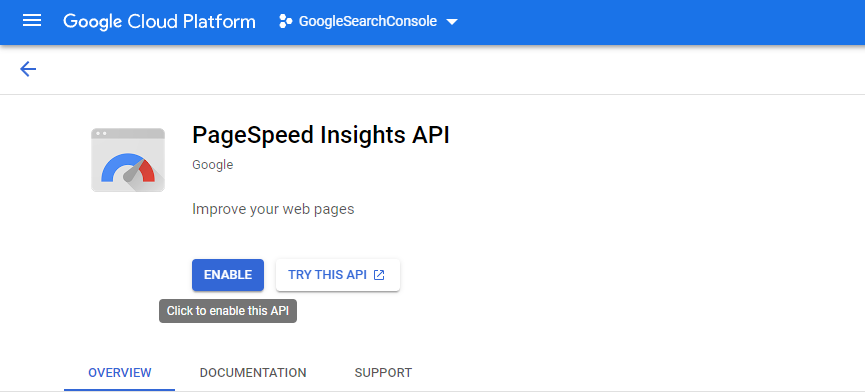 Image from developers.google.com, June 2022
You will need to use the specific API Key in your API Requests.
2. Import The Necessary Libraries
Use the lines below to import the fundamental libraries.
    import advertools as adv
    import pandas as pd
    import requests
    import json
    from datetime import datetime
    from urllib.parse import urlparse
3. Parse The URL For The Test Subject Website
To parse the URL of the subject website, use the code structure below.
  domain = urlparse(sitemap_url)
  domain = domain.netloc.split(".")[1]
The “domain” variable is the parsed version of the sitemap URL.
The “netloc” represents the specific URL’s domain section. When we split it with the “.” it takes the “middle section” which represents the domain name.
Here, “0” is for “www,” “1” for “domain name,” and “2” is for “domain extension,” if we split it with “.”
4. Take The Date Of Moment For File Name
To take the date of the specific function call moment, use the “datetime.now” method.
Datetime.now provides the specific time of the specific moment. Use the “strftime” with the “%Y”, “”%m”, and “%d” values. “%Y” is for the year. The “%m” and “%d” are numeric values for the specific month and the day.
date = datetime.now().strftime("%Y_%m_%d")
5. Take URLs Into A List From A Sitemap
To take the URLs into a list form from a sitemap file, use the code block below.
   sitemap = adv.sitemap_to_df(sitemap_url)
   sitemap_urls = sitemap["loc"].to_list()
If you read the Python Sitemap Health Audit, you can learn further information about the sitemaps.
6. Choose The Metrics That You Want From PSI API
To choose the PSI API response JSON properties, you should see the JSON file itself.
It is highly relevant to the reading, parsing, and flattening of JSON objects.
It is even related to Semantic SEO, thanks to the concept of “directed graph,” and “JSON-LD” structured data.
In this article, we won’t focus on examining the specific PSI API Response’s JSON hierarchies.
You can see the metrics that I have chosen to gather from PSI API. It is richer than the basic default output of PSI API, which only gives the Core Web Vitals Metrics, or Speed Index-Interaction to Next Paint, Time to First Byte, and First Contentful Paint.
Of course, it also gives “suggestions” by saying “Avoid Chaining Critical Requests,” but there is no need to put a sentence into a data frame.
In the future, these suggestions, or even every individual chain event, their KB and MS values can be taken into a single column with the name “psi_suggestions.”
For a start, you can check the metrics that I have chosen, and an important amount of them will be first for you.
PSI API Metrics, the first section is below.
    fid = []
    lcp = []
    cls_ = []
    url = []
    fcp = []
    performance_score = []
    total_tasks = []
    total_tasks_time = []
    long_tasks = []
    dom_size = []
    maximum_dom_depth = []
    maximum_child_element = []
    observed_fcp  = []
    observed_fid = []
    observed_lcp = []
    observed_cls = []
    observed_fp = []
    observed_fmp = []
    observed_dom_content_loaded = []
    observed_speed_index = []
    observed_total_blocking_time = []
    observed_first_visual_change = []
    observed_last_visual_change = []
    observed_tti = []
    observed_max_potential_fid = []
This section includes all the observed and simulated fundamental page speed metrics, along with some non-fundamental ones, like “DOM Content Loaded,” or “First Meaningful Paint.”
The second section of PSI Metrics focuses on possible byte and time savings from the unused code amount.
    render_blocking_resources_ms_save = []
    unused_javascript_ms_save = []
    unused_javascript_byte_save = []
    unused_css_rules_ms_save = []
    unused_css_rules_bytes_save = []
A third section of the PSI metrics focuses on server response time, responsive image usage benefits, or not, using harms.
    possible_server_response_time_saving = []
    possible_responsive_image_ms_save = []
Note: Overall Performance Score comes from “performance_score.”
7. Create A For Loop For Taking The API Response For All URLs
The for loop is to take all of the URLs from the sitemap file and use the PSI API for all of them one by one. The for loop for PSI API automation has several sections.
The first section of the PSI API for loop starts with duplicate URL prevention.
In the sitemaps, you can see a URL that appears multiple times. This section prevents it.
for i in sitemap_urls[:9]:
         # Prevent the duplicate "/" trailing slash URL requests to override the information.
         if i.endswith("/"):
               r = requests.get(f"https://www.googleapis.com/pagespeedonline/v5/runPagespeed?url={i}&strategy=mobile&locale=en&key={api_key}")
         else:
               r = requests.get(f"https://www.googleapis.com/pagespeedonline/v5/runPagespeed?url={i}/&strategy=mobile&locale=en&key={api_key}")
Remember to check the “api_key” at the end of the endpoint for PageSpeed Insights API.
Check the status code. In the sitemaps, there might be non-200 status code URLs; these should be cleaned.
         if r.status_code == 200:
               #print(r.json())
               data_ = json.loads(r.text)
               url.append(i)
The next section appends the specific metrics to the specific dictionary that we have created before “_data.”
               fcp.append(data_["loadingExperience"]["metrics"]["FIRST_CONTENTFUL_PAINT_MS"]["percentile"])
               fid.append(data_["loadingExperience"]["metrics"]["FIRST_INPUT_DELAY_MS"]["percentile"])
               lcp.append(data_["loadingExperience"]["metrics"]["LARGEST_CONTENTFUL_PAINT_MS"]["percentile"])
               cls_.append(data_["loadingExperience"]["metrics"]["CUMULATIVE_LAYOUT_SHIFT_SCORE"]["percentile"])
               performance_score.append(data_["lighthouseResult"]["categories"]["performance"]["score"] * 100)
Next section focuses on “total task” count, and DOM Size.
               total_tasks.append(data_["lighthouseResult"]["audits"]["diagnostics"]["details"]["items"][0]["numTasks"])
               total_tasks_time.append(data_["lighthouseResult"]["audits"]["diagnostics"]["details"]["items"][0]["totalTaskTime"])
               long_tasks.append(data_["lighthouseResult"]["audits"]["diagnostics"]["details"]["items"][0]["numTasksOver50ms"])
               dom_size.append(data_["lighthouseResult"]["audits"]["dom-size"]["details"]["items"][0]["value"])
The next section takes the “DOM Depth” and “Deepest DOM Element.”
               maximum_dom_depth.append(data_["lighthouseResult"]["audits"]["dom-size"]["details"]["items"][1]["value"])
               maximum_child_element.append(data_["lighthouseResult"]["audits"]["dom-size"]["details"]["items"][2]["value"])
The next section takes the specific observed test results during our Page Speed Insights API.
               observed_dom_content_loaded.append(data_["lighthouseResult"]["audits"]["metrics"]["details"]["items"][0]["observedDomContentLoaded"])
               observed_fid.append(data_["lighthouseResult"]["audits"]["metrics"]["details"]["items"][0]["observedDomContentLoaded"])
               observed_lcp.append(data_["lighthouseResult"]["audits"]["metrics"]["details"]["items"][0]["largestContentfulPaint"])
               observed_fcp.append(data_["lighthouseResult"]["audits"]["metrics"]["details"]["items"][0]["firstContentfulPaint"])
               observed_cls.append(data_["lighthouseResult"]["audits"]["metrics"]["details"]["items"][0]["totalCumulativeLayoutShift"])
               observed_speed_index.append(data_["lighthouseResult"]["audits"]["metrics"]["details"]["items"][0]["observedSpeedIndex"])
               observed_total_blocking_time.append(data_["lighthouseResult"]["audits"]["metrics"]["details"]["items"][0]["totalBlockingTime"])
               observed_fp.append(data_["lighthouseResult"]["audits"]["metrics"]["details"]["items"][0]["observedFirstPaint"])
               observed_fmp.append(data_["lighthouseResult"]["audits"]["metrics"]["details"]["items"][0]["firstMeaningfulPaint"])
               observed_first_visual_change.append(data_["lighthouseResult"]["audits"]["metrics"]["details"]["items"][0]["observedFirstVisualChange"])
               observed_last_visual_change.append(data_["lighthouseResult"]["audits"]["metrics"]["details"]["items"][0]["observedLastVisualChange"])
               observed_tti.append(data_["lighthouseResult"]["audits"]["metrics"]["details"]["items"][0]["interactive"])
               observed_max_potential_fid.append(data_["lighthouseResult"]["audits"]["metrics"]["details"]["items"][0]["maxPotentialFID"])
The next section takes the Unused Code amount and the wasted bytes, in milliseconds along with the render-blocking resources.
               render_blocking_resources_ms_save.append(data_["lighthouseResult"]["audits"]["render-blocking-resources"]["details"]["overallSavingsMs"])
               unused_javascript_ms_save.append(data_["lighthouseResult"]["audits"]["unused-javascript"]["details"]["overallSavingsMs"])
               unused_javascript_byte_save.append(data_["lighthouseResult"]["audits"]["unused-javascript"]["details"]["overallSavingsBytes"])
               unused_css_rules_ms_save.append(data_["lighthouseResult"]["audits"]["unused-css-rules"]["details"]["overallSavingsMs"])
               unused_css_rules_bytes_save.append(data_["lighthouseResult"]["audits"]["unused-css-rules"]["details"]["overallSavingsBytes"])
The next section is to provide responsive image benefits and server response timing.
               possible_server_response_time_saving.append(data_["lighthouseResult"]["audits"]["server-response-time"]["details"]["overallSavingsMs"])
               possible_responsive_image_ms_save.append(data_["lighthouseResult"]["audits"]["uses-responsive-images"]["details"]["overallSavingsMs"])
The next section is to make the function continue to work in case there is an error.
         else:
           continue
Example Usage Of Page Speed Insights API With Python For Bulk Testing
To use the specific code blocks, put them into a Python function.
Run the script, and you will get 29 page speed-related metrics in the columns below.
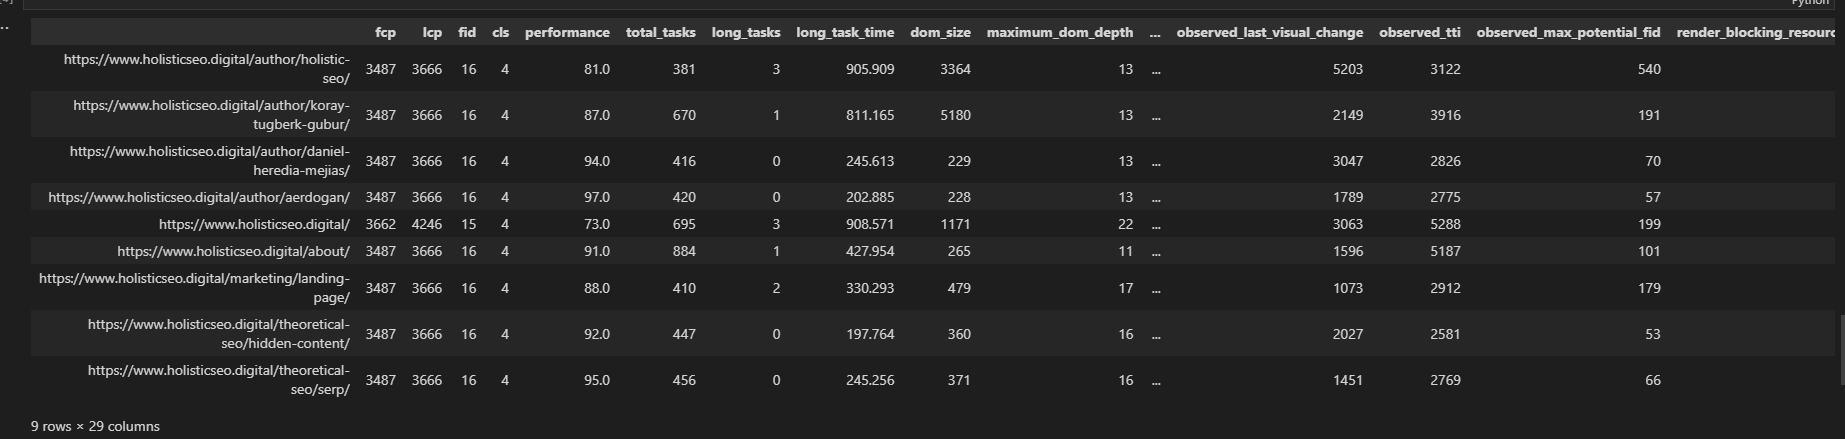 Screenshot from author, June 2022
Conclusion
PageSpeed Insights API provides different types of page loading performance metrics.
It demonstrates how Google engineers perceive the concept of page loading performance, and possibly use these metrics as a ranking, UX, and quality-understanding point of view.
Using Python for bulk page speed tests gives you a snapshot of the entire website to help analyze the possible user experience, crawl efficiency, conversion rate, and ranking improvements.
More resources:
Featured Image: Dundanim/Shutterstock
if( typeof sopp !== "undefined" && sopp === 'yes' ){ fbq('dataProcessingOptions', ['LDU'], 1, 1000); }else{ fbq('dataProcessingOptions', []); }
fbq('init', '1321385257908563');
fbq('track', 'PageView');
fbq('trackSingle', '1321385257908563', 'ViewContent', { content_name: 'pagespeed-insights-api-python-test', content_category: 'technical-seo digital-marketing-tools' }); }
