Getting the internal linking optimized is important if you care about your site pages having enough authority to rank for their target keywords. By internal linking what we mean are pages on your website receiving links from other pages.
This is important because this is the basis by which Google and other searches compute the importance of the page relative to other pages on your website.
It also affects how likely a user would discover content on your site. Content discovery is the basis of the Google PageRank algorithm.
Today, we’re exploring a data-driven approach to improving the internal linking of a website for the purposes of more effective technical site SEO. That is to ensure the distribution of internal domain authority is optimized according to the site structure.
Improving Internal Link Structures With Data Science
Our data-driven approach will focus on just one aspect of optimizing the internal link architecture, which is to model the distribution of internal links by site depth and then target the pages that are lacking links for their particular site depth.
Advertisement
Continue Reading Below
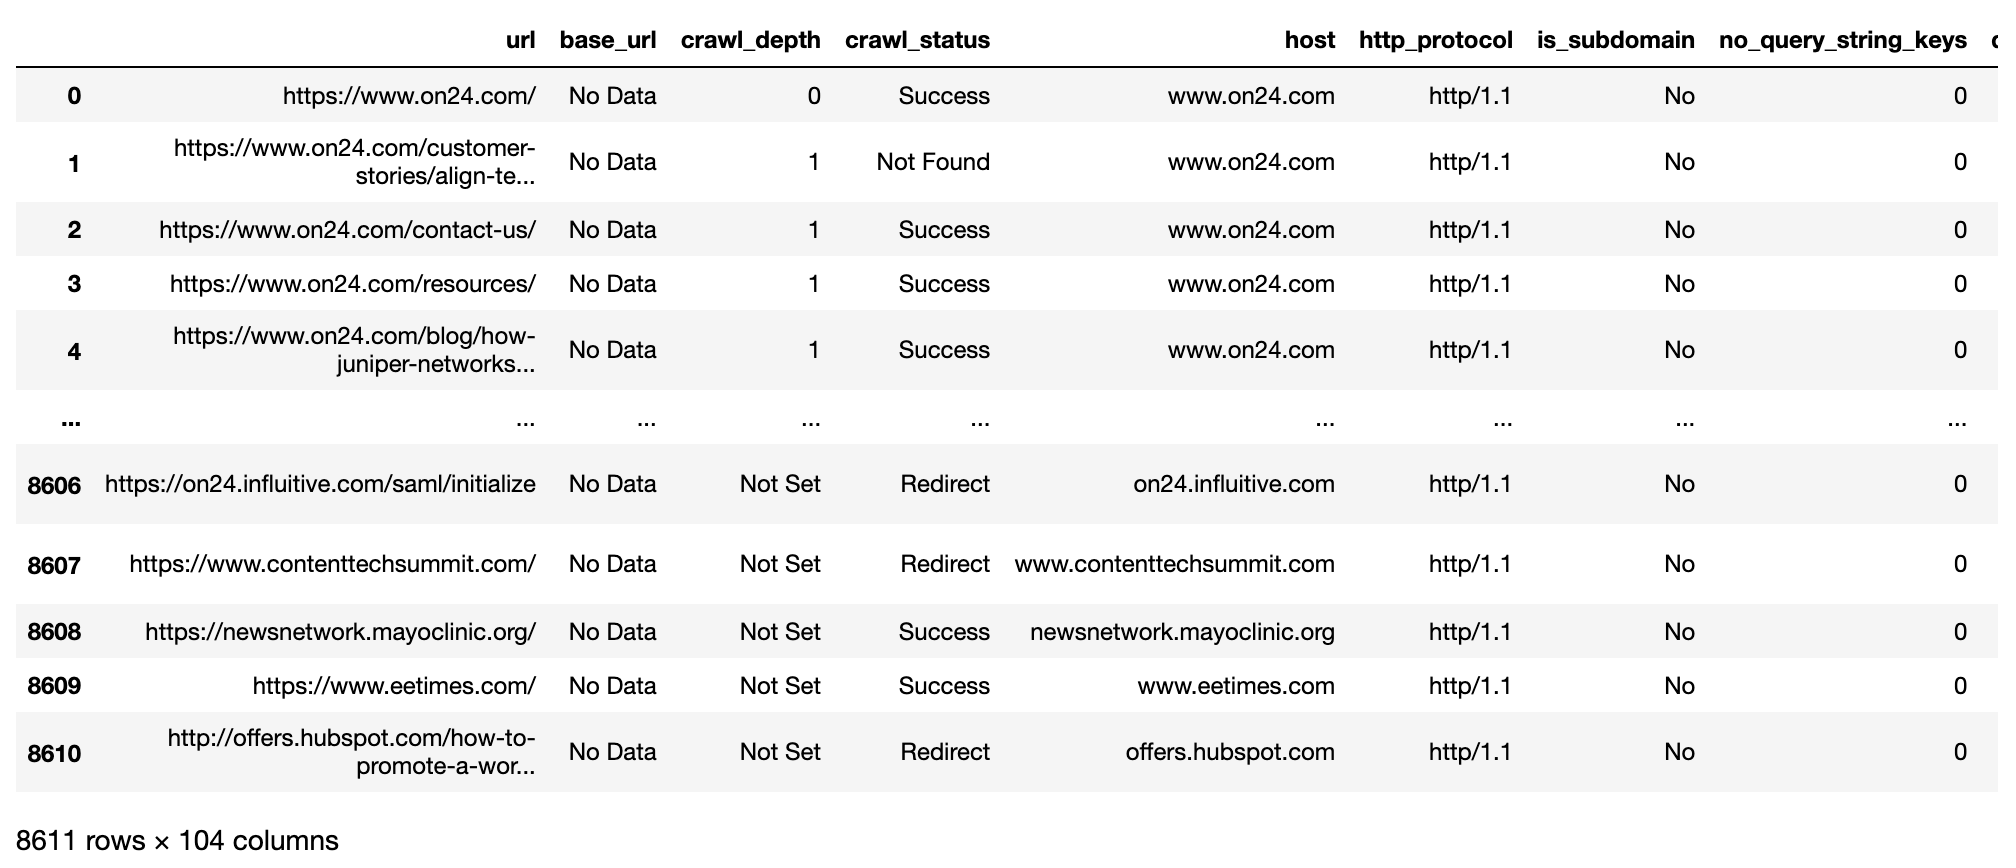
We start by importing the libraries and data, cleaning up the column names before previewing them:
The above shows a preview of the data imported from the Sitebulb desktop crawler application. There are over 8,000 rows and not all of them will be exclusive to the domain, as it will also include resource URLs and external outbound link URLs.
We also have over 100 columns that are superfluous to requirements, so some column selection will be required.
Advertisement
Continue Reading Below
Before we get into that, however, we want to quickly see how many site levels there are:
So from the above, we can see that there are 14 site levels and most of these are not found in the site architecture, but in the XML sitemap.
You may notice that Pandas (the Python package for handling data) orders the site levels by digit.
That’s because the site levels are at this stage character strings as opposed to numeric. This will be adjusted in later code, as it will affect data visualization (‘viz’).
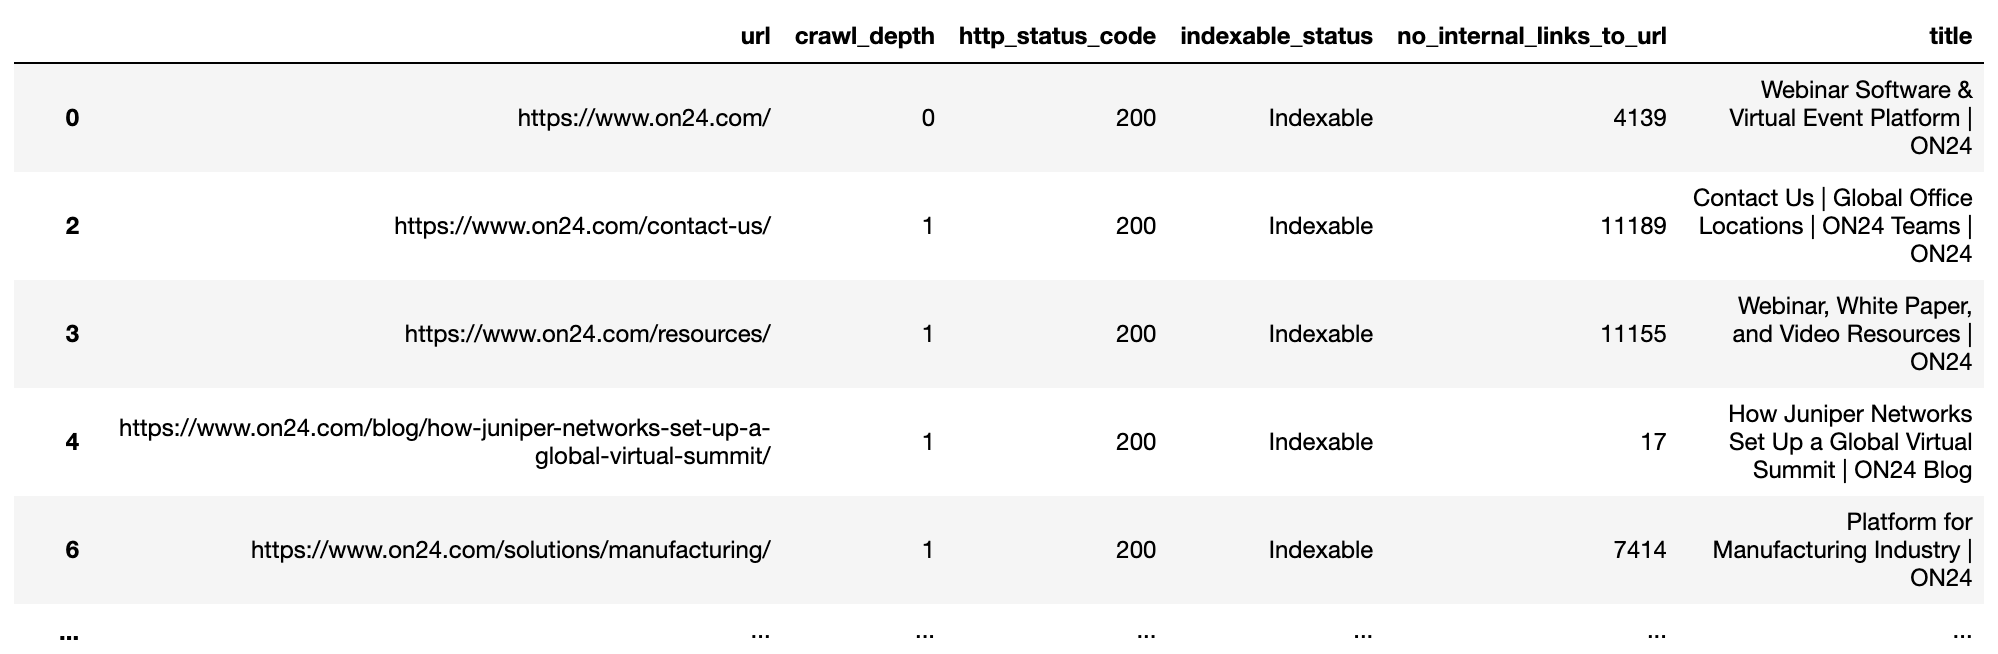
By filtering rows for indexable URLs and selecting the relevant columns we now have a more streamlined data frame (think Pandas version of a spreadsheet tab).
Exploring The Distribution Of Internal Links
Now we’re ready to data viz the data and get a feel of how the internal links are distributed overall and by site depth.
from plotnine import *
import matplotlib.pyplot as plt
pd.set_option('display.max_colwidth', None)
%matplotlib inline
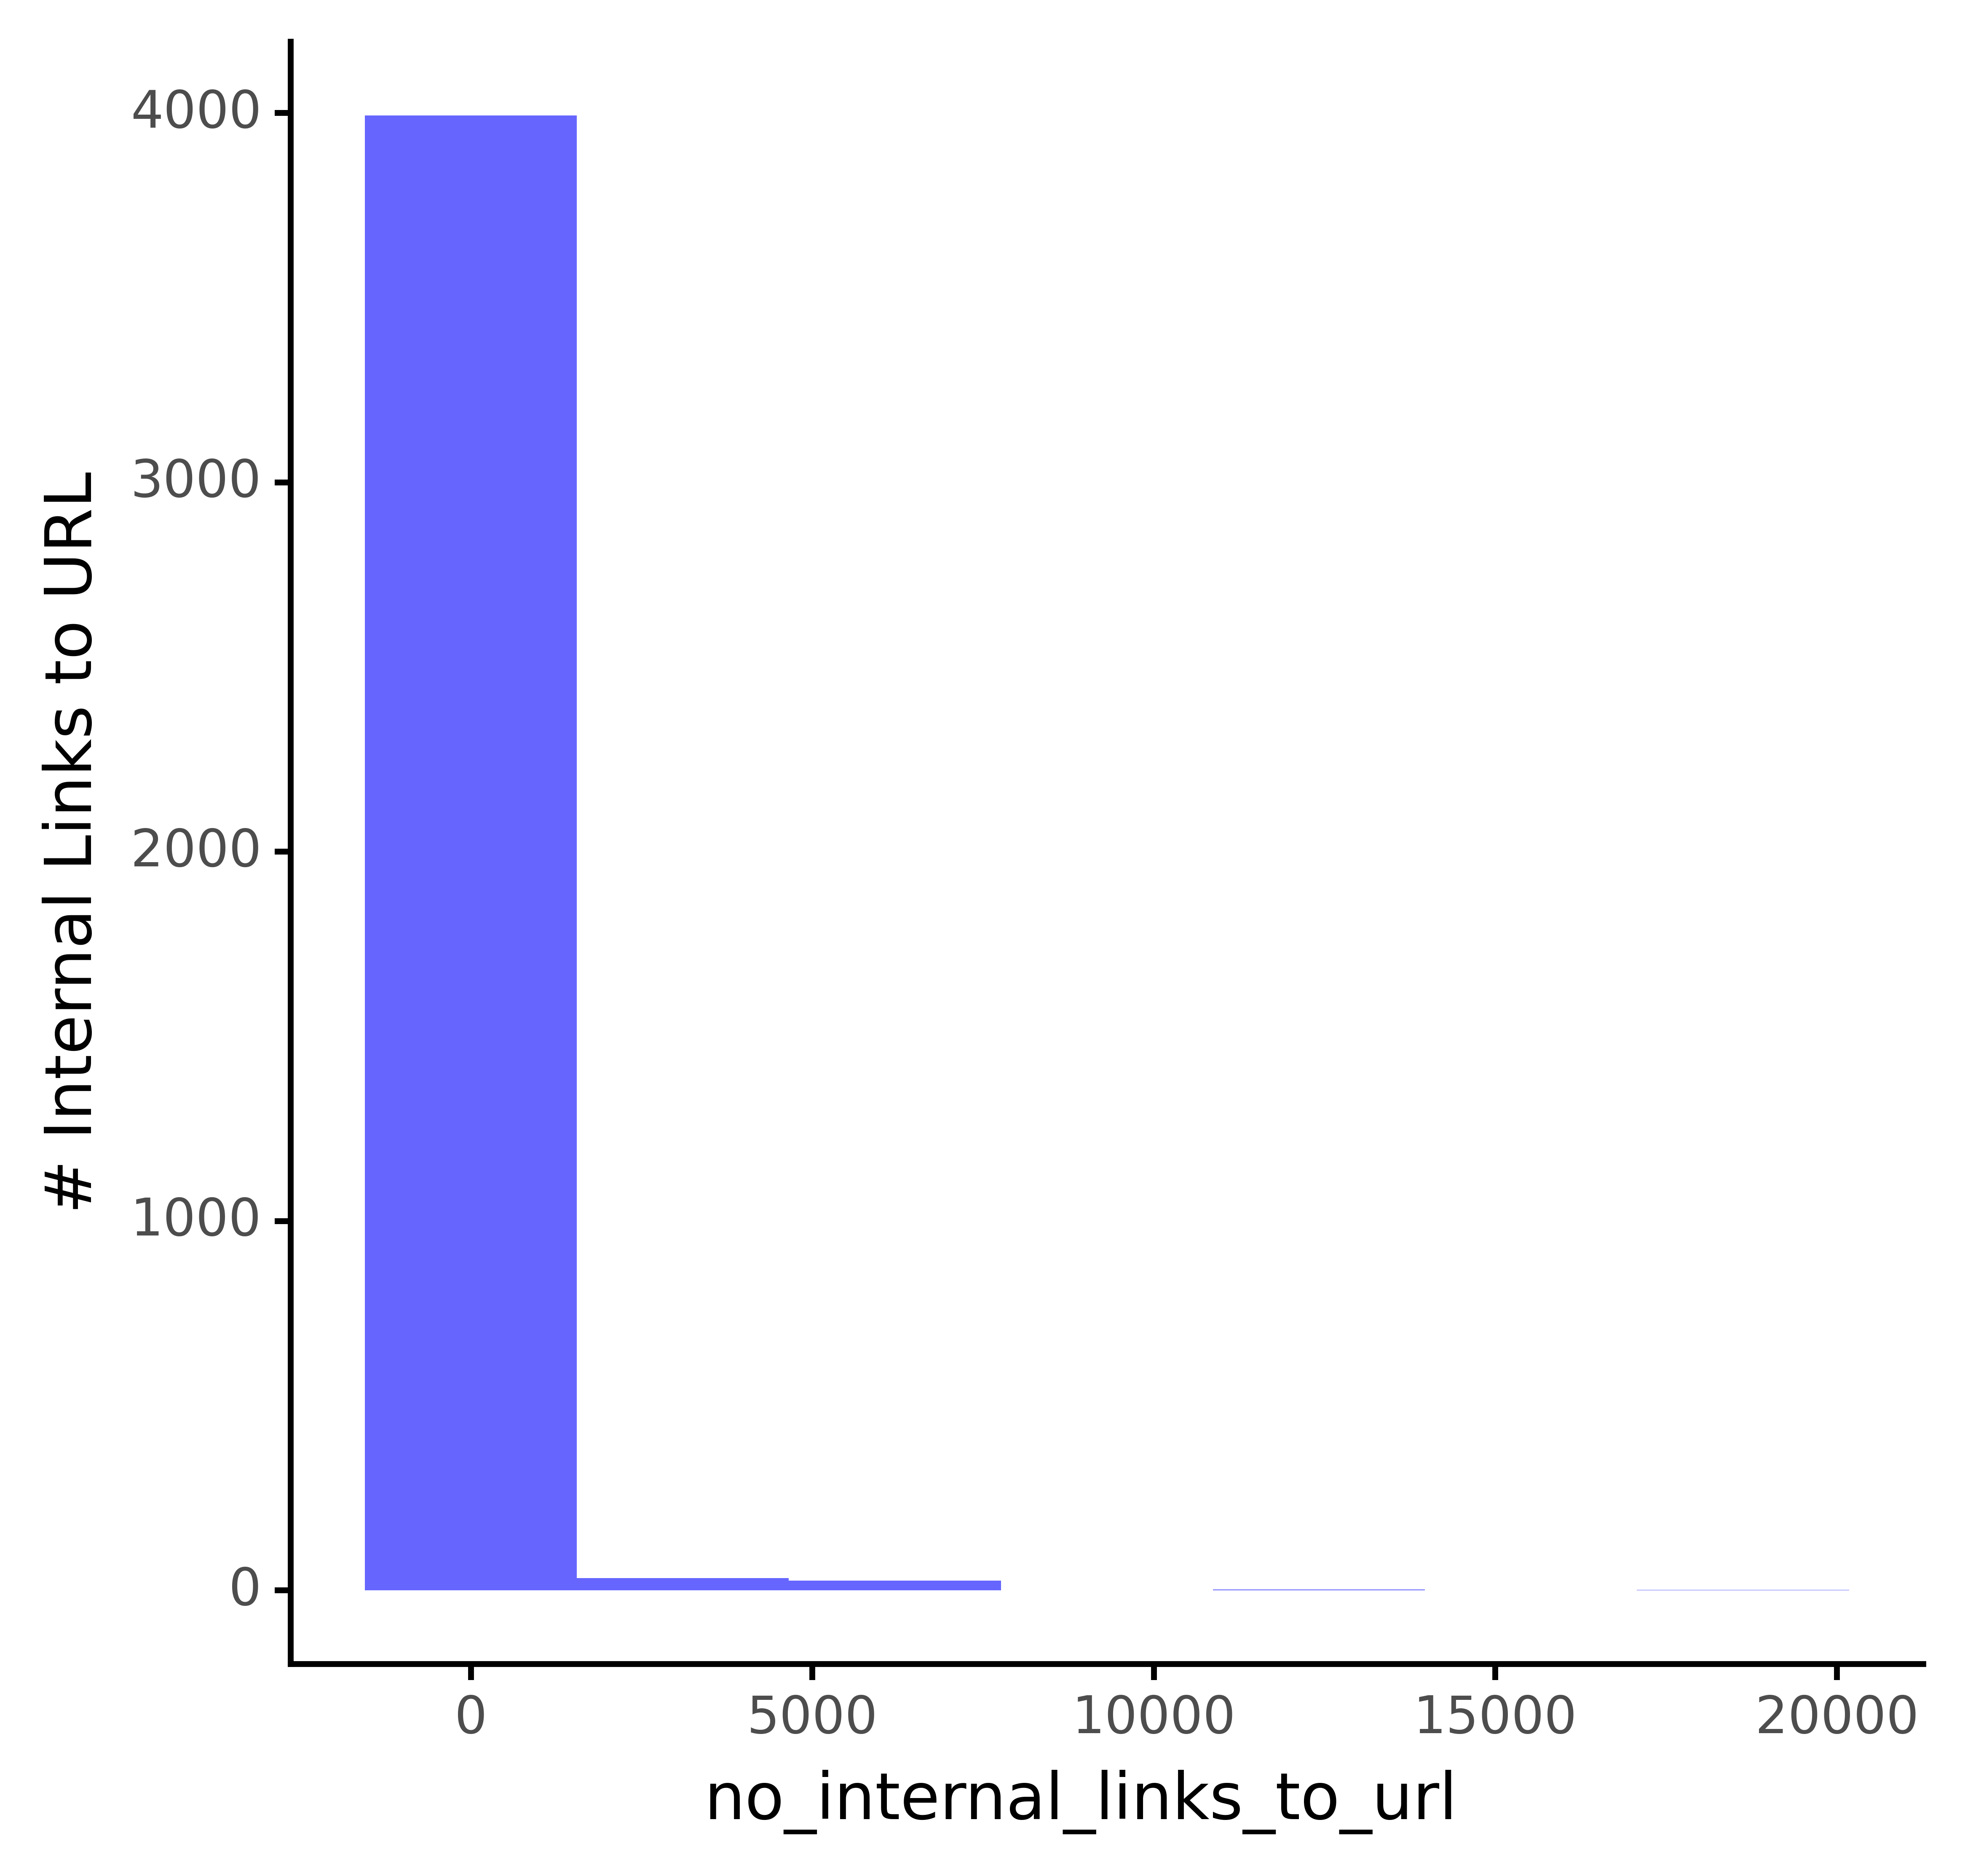
# Distribution of internal links to URL by site level
ove_intlink_dist_plt = (ggplot(redir_live_urls, aes(x = 'no_internal_links_to_url')) +
geom_histogram(fill="blue", alpha = 0.6, bins = 7) +
labs(y = '# Internal Links to URL') +
theme_classic() +
theme(legend_position = 'none')
)
ove_intlink_dist_plt
Andreas Voniatis, November 2021
From the above we can see overwhelmingly that most pages have no links, so improving the internal linking would be a significant opportunity to improve the SEO here.
The table above shows the rough distribution of internal links by site level, including the average (mean) and median (50% quantile).
This is along with the variation within the site level (std for standard deviation), which tells us how close to the average the pages are within the site level; i.e., how consistent the internal link distribution is with the average.
We can surmise from the above that the average by site-level, with the exception of the home page (crawl depth 0) and the first level pages (crawl depth 1), ranges from 0 to 4 per URL.
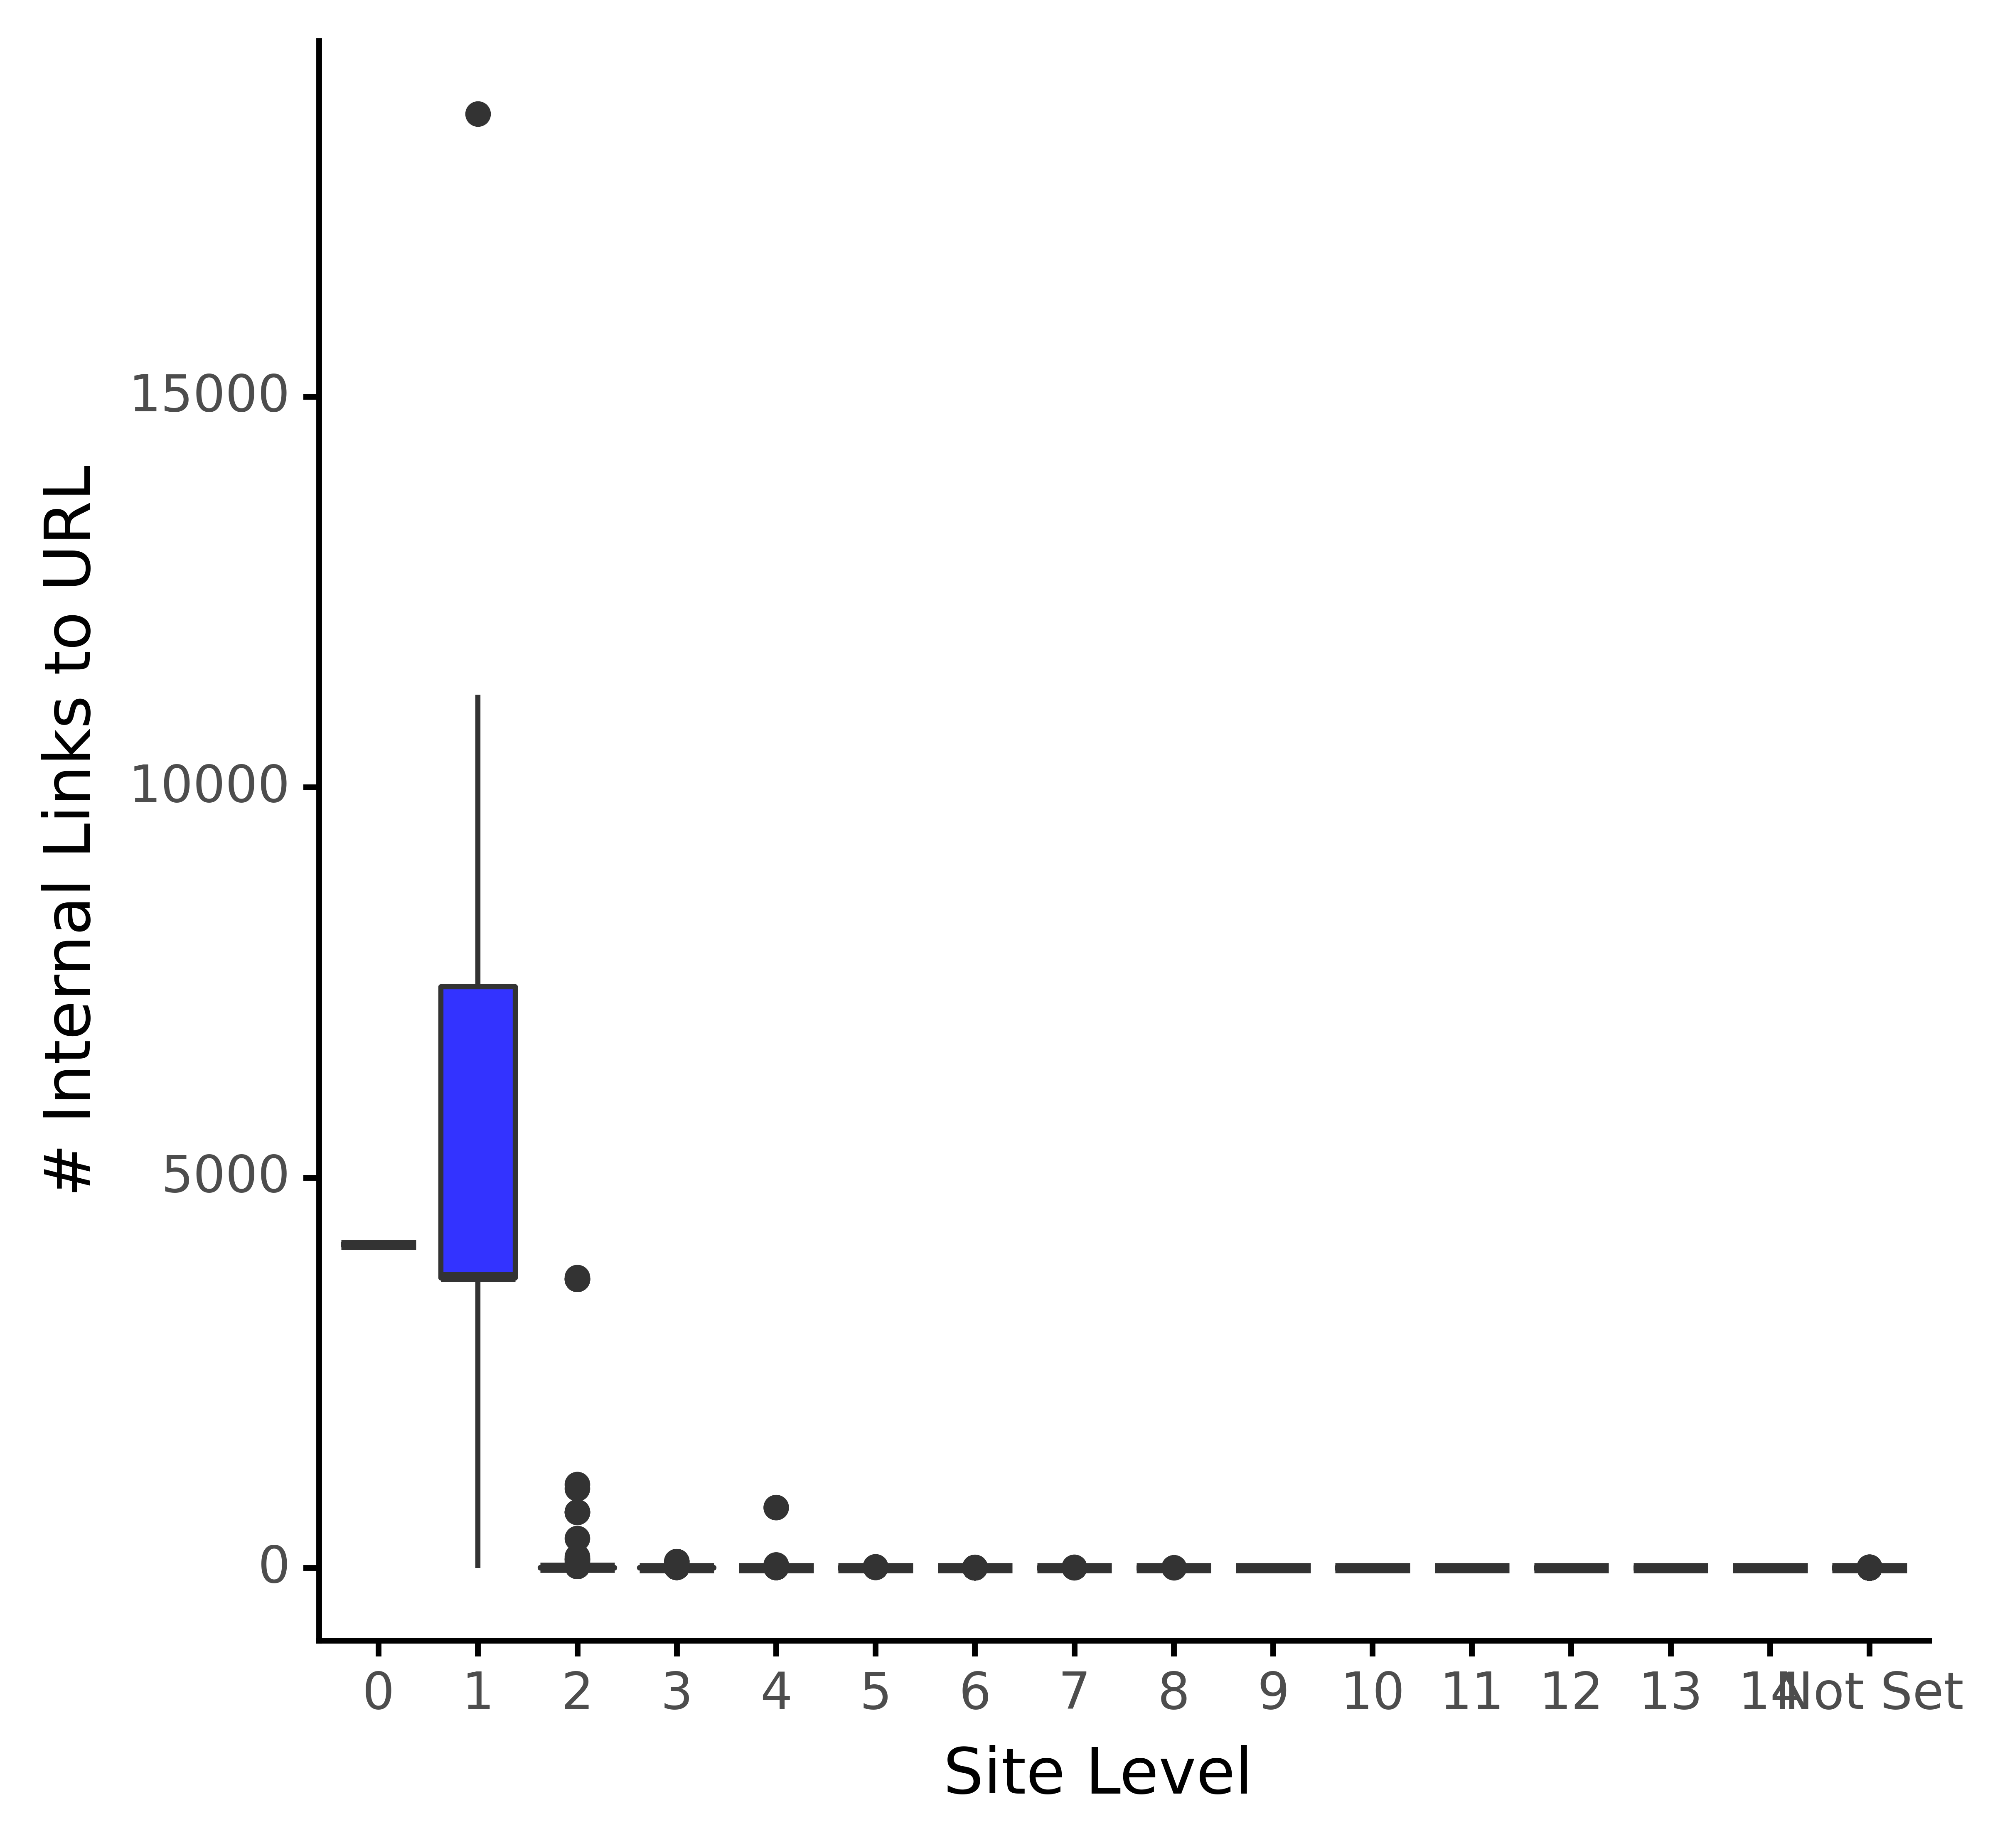
For a more visual approach:
# Distribution of internal links to URL by site level
intlink_dist_plt = (ggplot(redir_live_urls, aes(x = 'crawl_depth', y = 'no_internal_links_to_url')) +
                    geom_boxplot(fill="blue", alpha = 0.8) +
                    labs(y = '# Internal Links to URL', x = 'Site Level') +
                    theme_classic() +
                    theme(legend_position = 'none')
                   )

intlink_dist_plt.save(filename="images/1_intlink_dist_plt.png", height=5, width=5, units="in", dpi=1000)
intlink_dist_plt
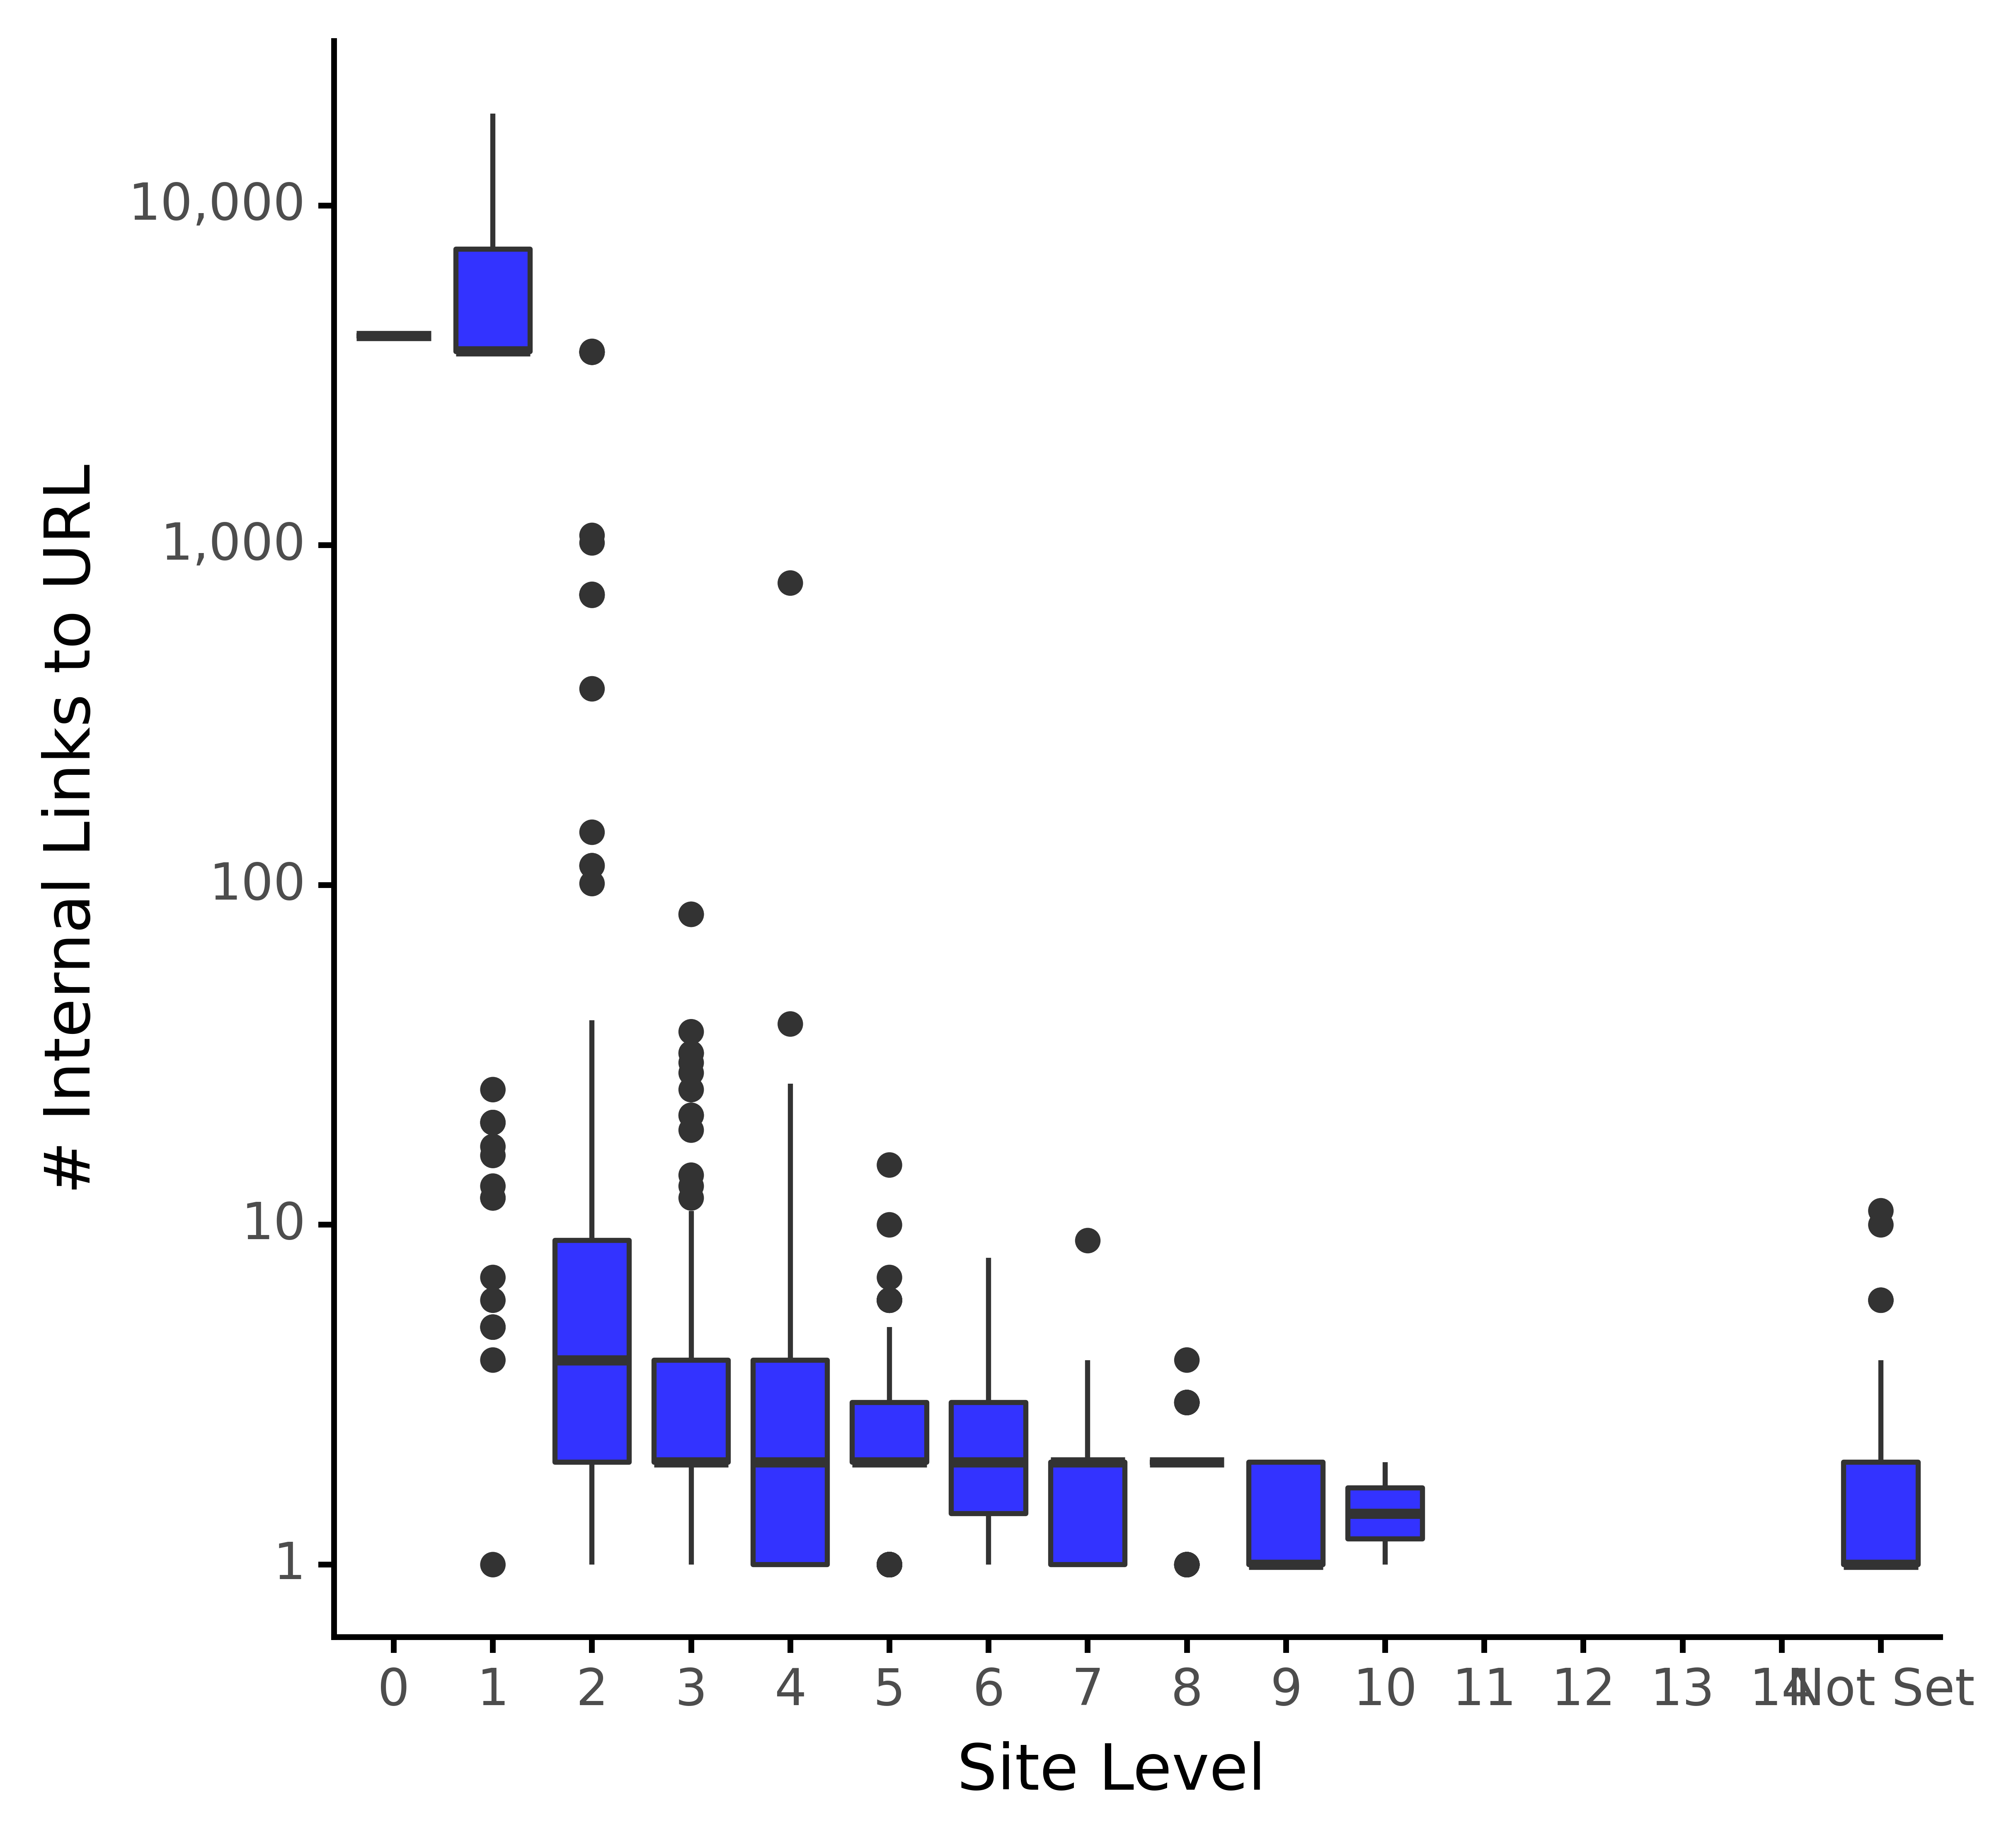
Andreas Voniatis, November 2021
The above plot confirms our earlier comments that the home page and the pages directly linked from it receive the lion’s share of the links.
Advertisement
Continue Reading Below
With the scales as they are, we don’t have much of a view on the distribution of the lower levels. We’ll amend this by taking a logarithm of the y axis:
# Distribution of internal links to URL by site level
from mizani.formatters import comma_format

intlink_dist_plt = (ggplot(redir_live_urls, aes(x = 'crawl_depth', y = 'no_internal_links_to_url')) +
                    geom_boxplot(fill="blue", alpha = 0.8) +
                    labs(y = '# Internal Links to URL', x = 'Site Level') +
                    scale_y_log10(labels = comma_format()) +
                    theme_classic() +
                    theme(legend_position = 'none')
                   )

intlink_dist_plt.save(filename="images/1_log_intlink_dist_plt.png", height=5, width=5, units="in", dpi=1000)
intlink_dist_plt
Andreas Voniatis, November 2021
The above shows the same distribution of the links with the logarithmic view, which helps us confirm the distribution averages for the lower levels. This is much easier to visualize.
Given the disparity between the first two site levels and the remaining site, this is indicative of a skewed distribution.
Advertisement
Continue Reading Below
As a result, I will take a logarithm of the internal links, which will help normalize the distribution.
Now we have the normalized number of links, which we’ll visualize:
# Distribution of internal links to URL by site level
intlink_dist_plt = (ggplot(redir_live_urls, aes(x = 'crawl_depth', y = 'log_intlinks')) +
                    geom_boxplot(fill="blue", alpha = 0.8) +
                    labs(y = '# Log Internal Links to URL', x = 'Site Level') +
                    #scale_y_log10(labels = comma_format()) +
                    theme_classic() +
                    theme(legend_position = 'none')
                   )

intlink_dist_plt
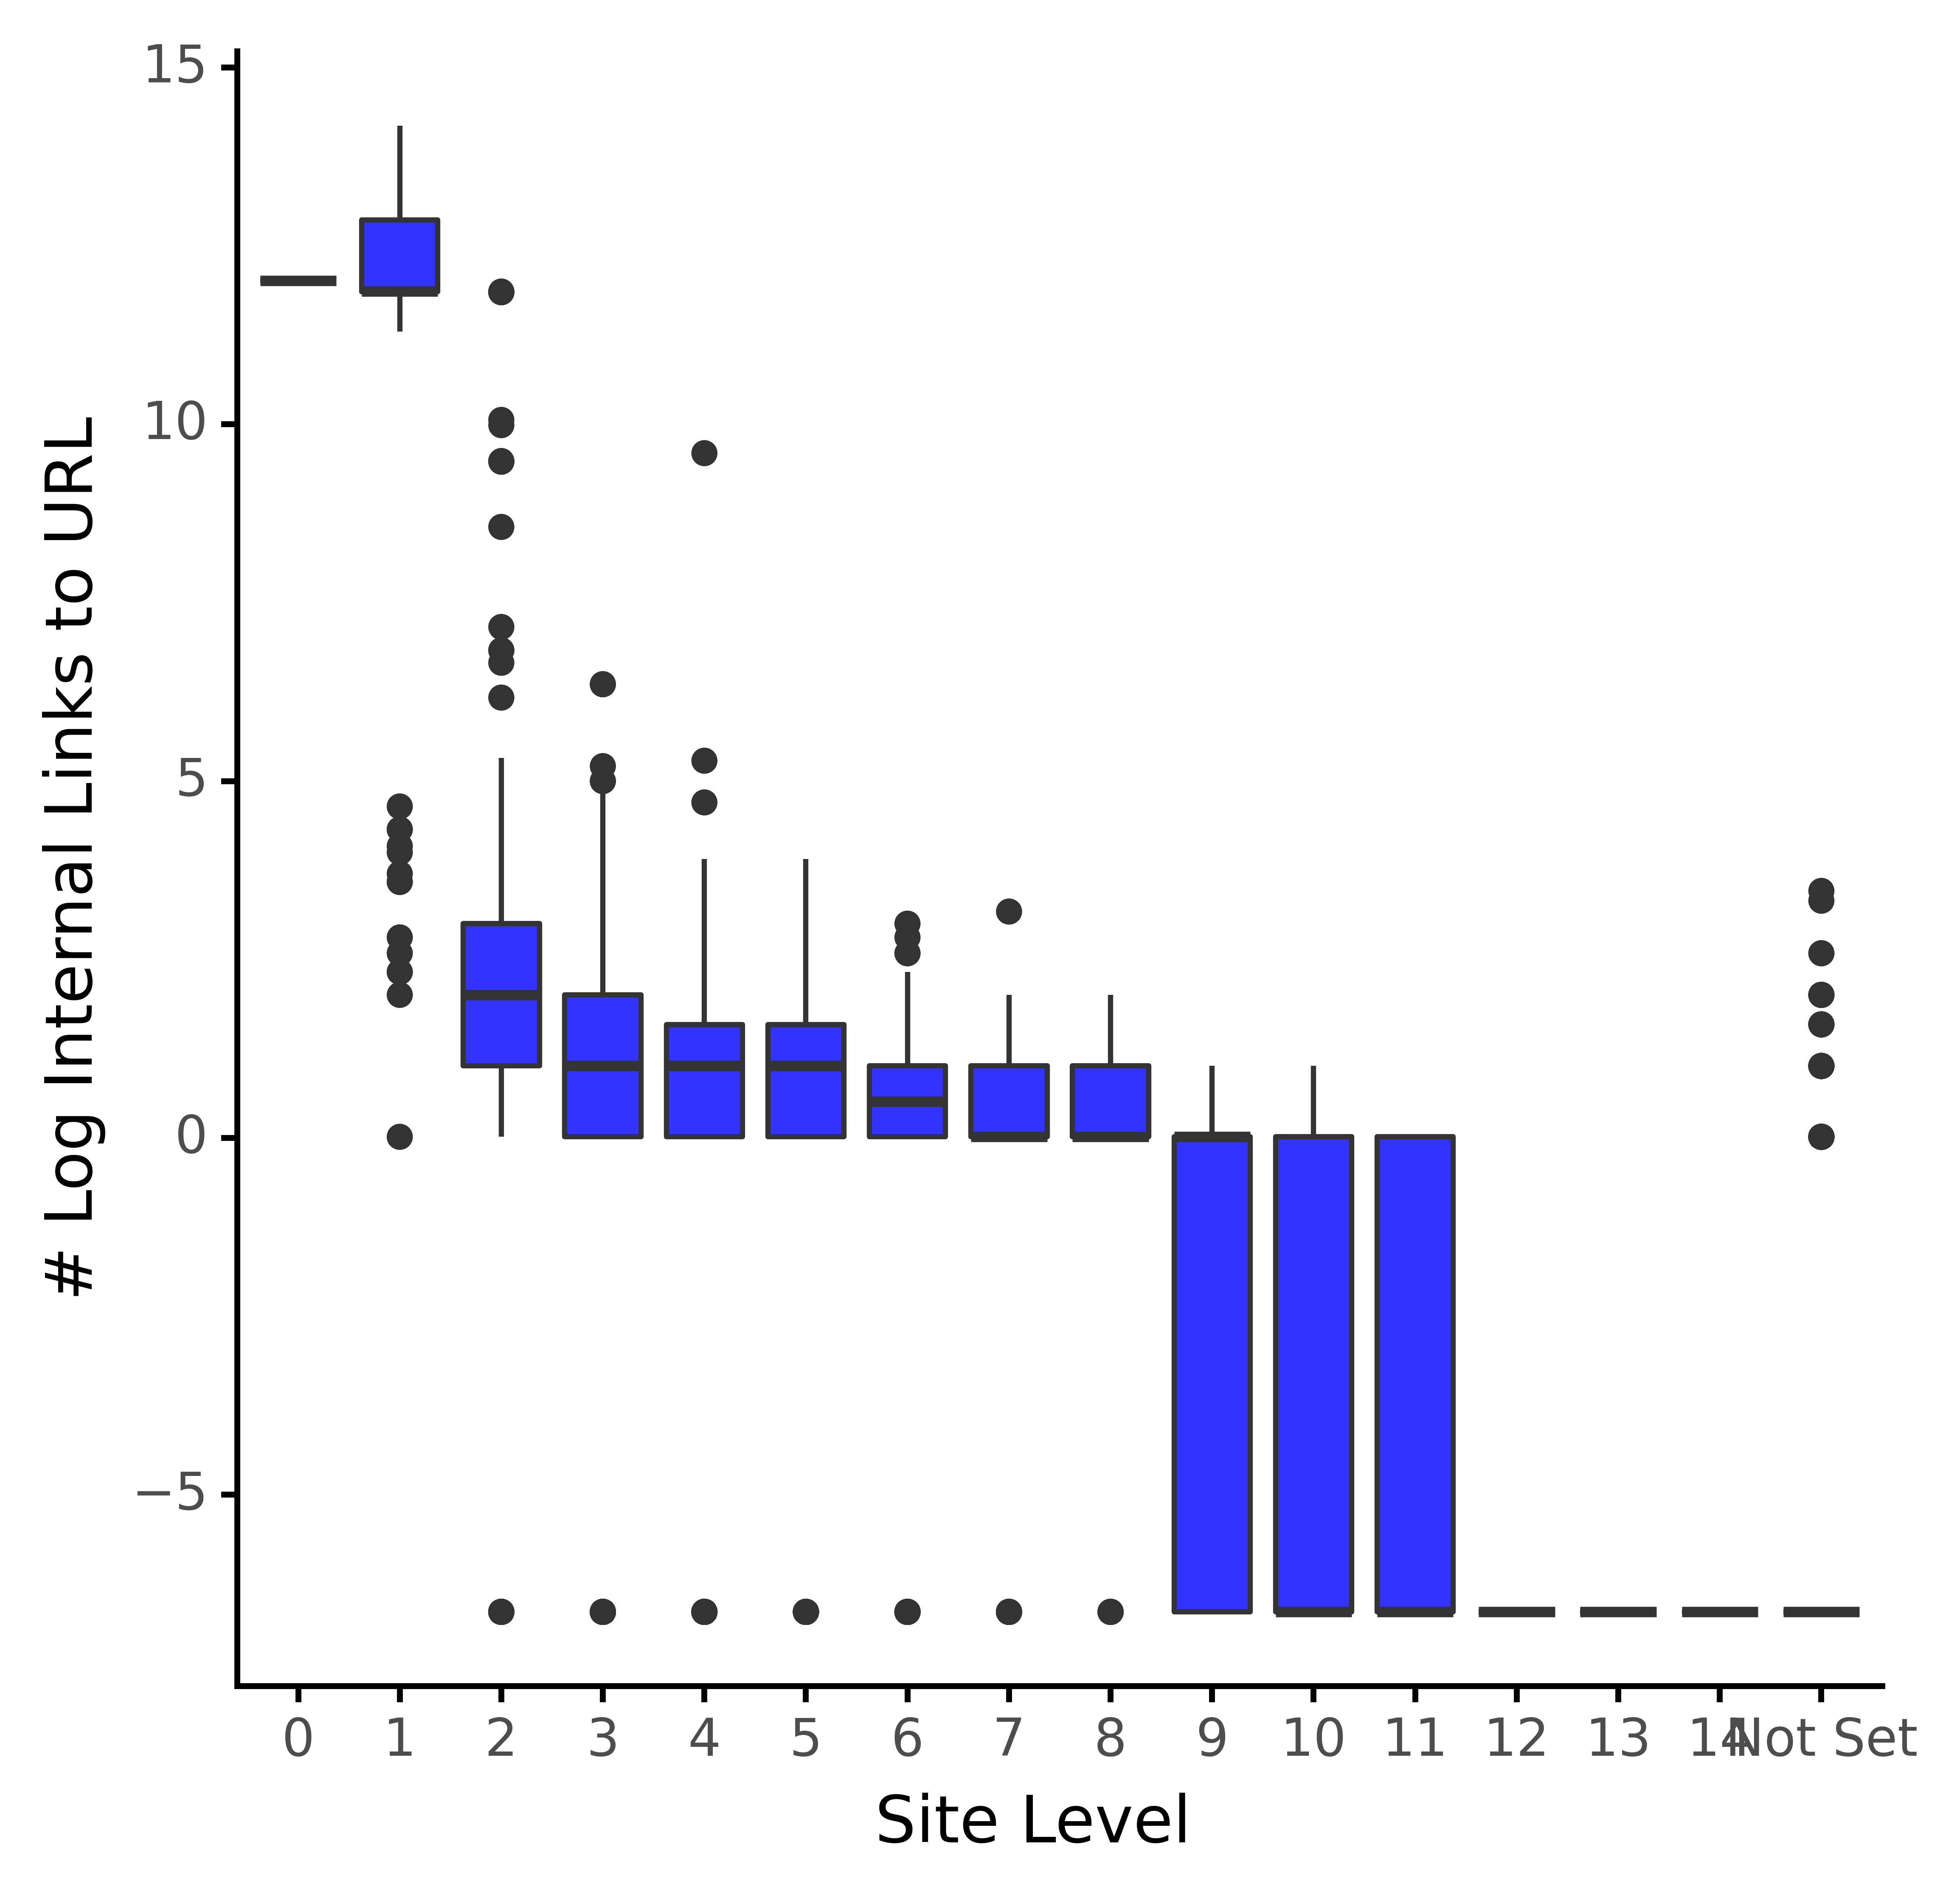
Andreas Voniatis, November 2021
From the above, the distribution looks a lot less skewed, as the boxes (interquartile ranges) have a more gradual step change from site level to the site level.
This sets us up nicely for analyzing the data before diagnosing which URLs are under-optimized from an internal link point of view.
Advertisement
Continue Reading Below
Quantifying The Issues
The code below will calculate the lower 35th quantile (data science term for percentile) for each site depth.
# internal links in under/over indexing at site level
# count of URLs under indexed for internal link counts
quantiled_intlinks = redir_live_urls.groupby('crawl_depth').agg({'log_intlinks':
[quantile_lower]}).reset_index()
quantiled_intlinks = quantiled_intlinks.rename(columns = {'crawl_depth_': 'crawl_depth',
'log_intlinks_quantile_lower': 'sd_intlink_lowqua'})
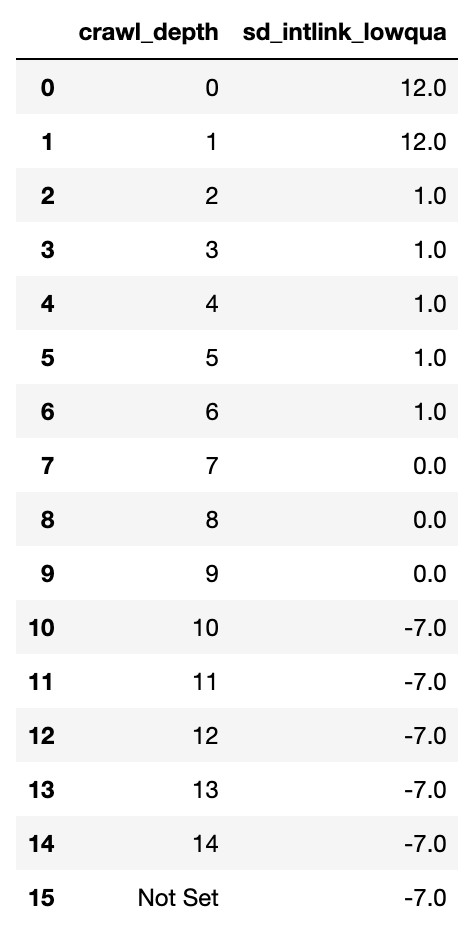
quantiled_intlinks
Andreas Voniatis, November 2021
The above shows the calculations. The numbers are meaningless to an SEO practitioner at this stage, as they are arbitrary and for the purpose of providing a cut-off for under-linked URLs at each site level.
Now that we have the table, we’ll merge these with the main data set to work out whether the URL row by row is under-linked or not.
Advertisement
Continue Reading Below
# join quantiles to main df and then count
redir_live_urls_underidx = redir_live_urls.merge(quantiled_intlinks, on = 'crawl_depth', how = 'left')

redir_live_urls_underidx['sd_int_uidx'] = redir_live_urls_underidx.apply(sd_intlinkscount_underover, axis=1)
redir_live_urls_underidx['sd_int_uidx'] = np.where(redir_live_urls_underidx['crawl_depth'] == 'Not Set', 1,
                                                   redir_live_urls_underidx['sd_int_uidx'])

redir_live_urls_underidx
Now we have a data frame with each URL marked as under-linked under the ‘’sd_int_uidx’ column as a 1.
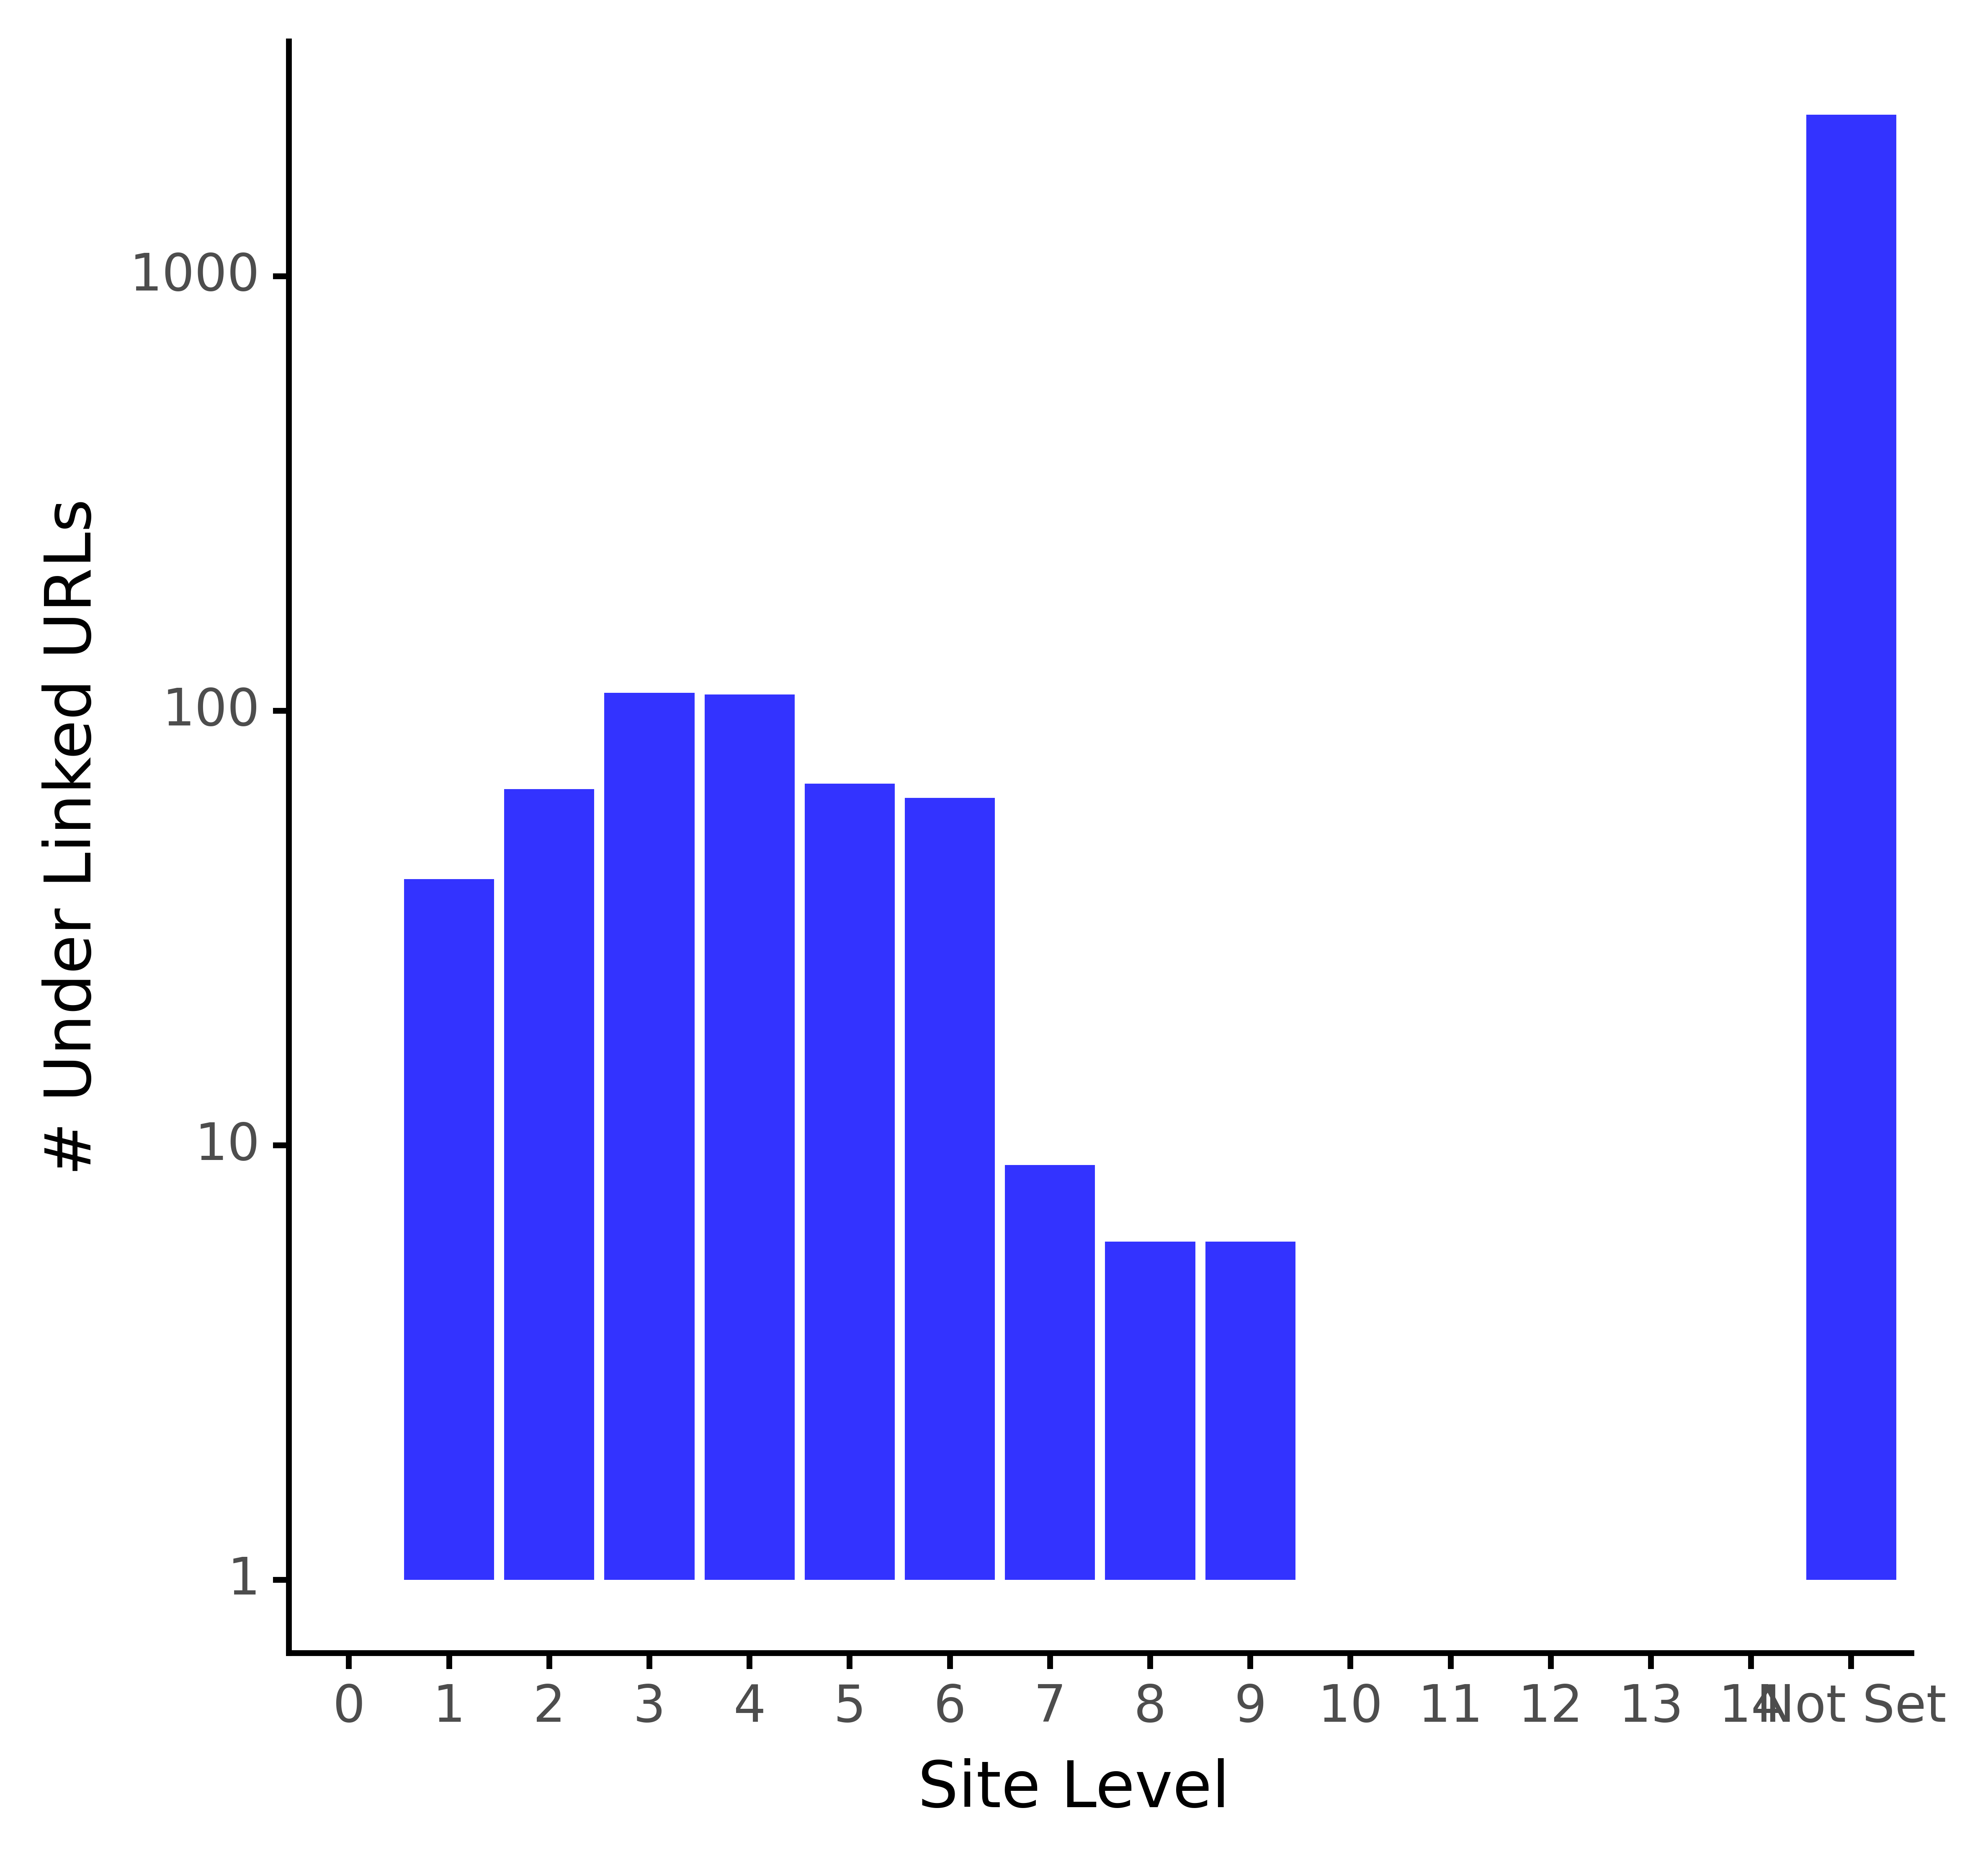
This puts us in a position to sum the amount of under-linked site pages by site depth:
With the exception of the XML sitemap URLs, the distribution of under-linked URLs looks normal as indicated by the near bell shape. Most of the under-linked URLs are in site levels 3 and 4.
Advertisement
Continue Reading Below
Exporting The List Of Under-Linked URLs
Now that we have a grip on the under-linked URLs by site level, we can export the data and come up with creative solutions to bridge the gaps in site depth as shown below.
# data dump of under performing backlinks
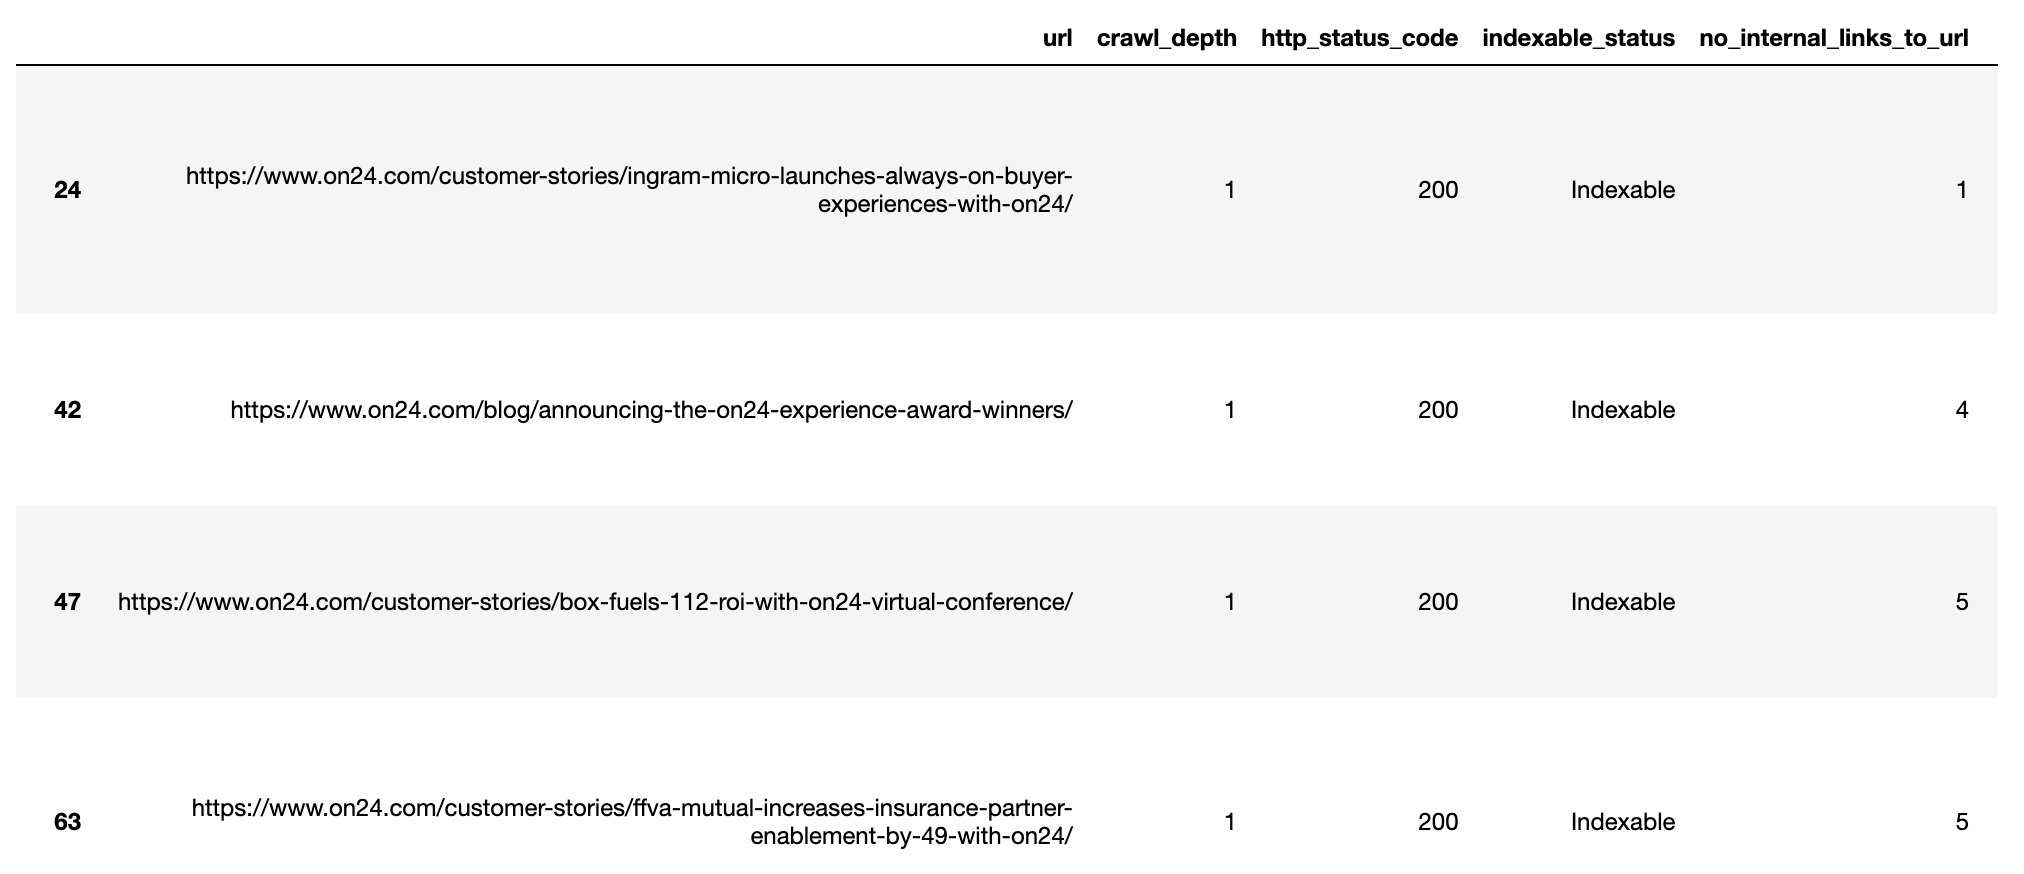
underlinked_urls = redir_live_urls_underidx.loc[redir_live_urls_underidx.sd_int_uidx == 1]
underlinked_urls = underlinked_urls.sort_values(['crawl_depth', 'no_internal_links_to_url'])
underlinked_urls.to_csv('exports/underlinked_urls.csv')
underlinked_urls
Andreas Voniatis, November 2021
Other Data Science Techniques For Internal Linking
We briefly covered the motivation for improving a site’s internal links before exploring how internal links are distributed across the site by site level.
Advertisement
Continue Reading Below
Then we proceeded to quantify the extent of the under-linking issue both numerically and visually before exporting the results for recommendations.
Naturally, site-level is just one aspect of internal links that can be explored and analyzed statistically.
Other aspects that could apply data science techniques to internal links include and obviously are not limited to:
Denial of responsibility! Search Engine Codex is an automatic aggregator of the all world’s media. In each content, the hyperlink to the primary source is specified. All trademarks belong to their rightful owners, all materials to their authors. If you are the owner of the content and do not want us to publish your materials, please contact us by email – [email protected]. The content will be deleted within 24 hours.